. 2011 Nov 15;589(Pt 22):5453-66.
doi: 10.1113/jphysiol.2011.218909. Epub 2011 Sep 19.

Gap junctions and other mechanisms of cell-cell communication regulate basal insulin secretion in the pancreatic islet

Affiliations

Gap junctions and other mechanisms of cell-cell communication regulate basal insulin secretion in the pancreatic islet

R K P Benninger et al. J Physiol. .

Abstract

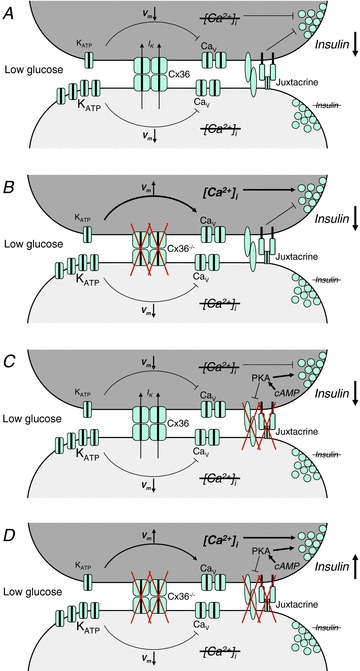
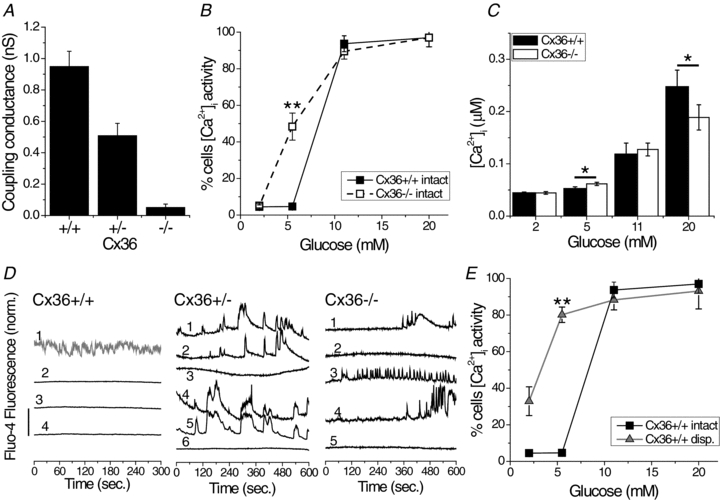
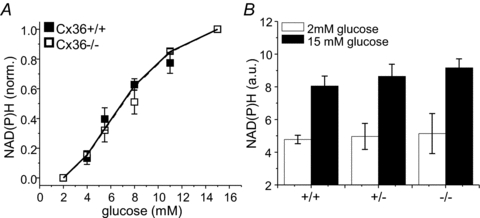
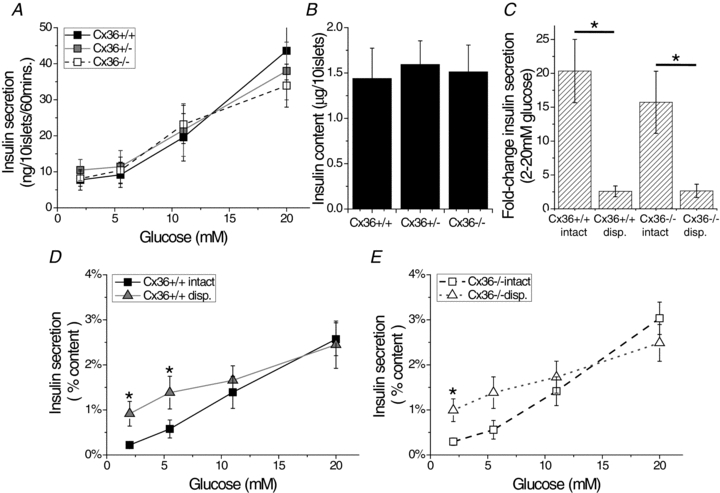
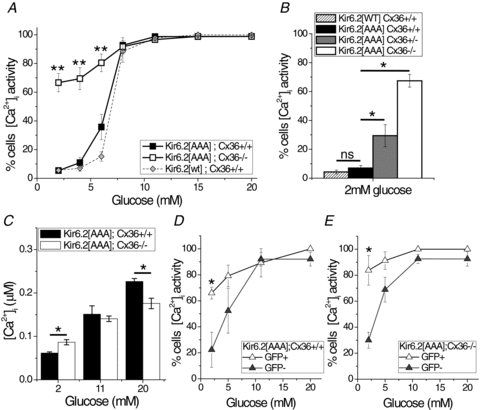
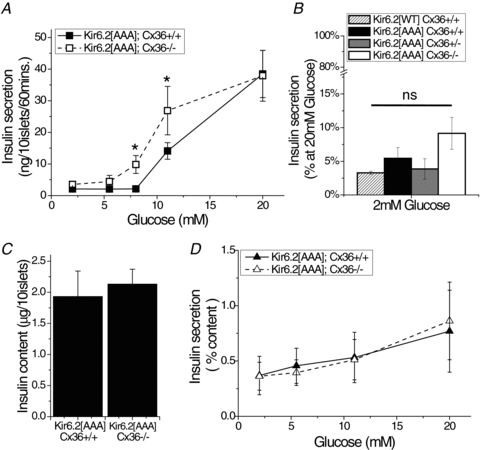
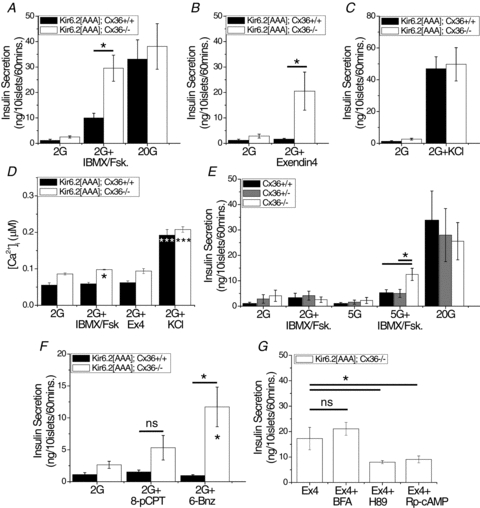
Cell-cell communication in the islet of Langerhans is important for the regulation of insulin secretion. Gap-junctions coordinate oscillations in intracellular free-calcium ([Ca(2+)](i)) and insulin secretion in the islet following elevated glucose. Gap-junctions can also ensure that oscillatory [Ca(2+)](i) ceases when glucose is at a basal levels. We determine the roles of gap-junctions and other cell-cell communication pathways in the suppression of insulin secretion under basal conditions. Metabolic, electrical and insulin secretion levels were measured from islets lacking gap-junction coupling following deletion of connexion36 (Cx36(-/-)), and these results were compared to those obtained using fully isolated β-cells. K(ATP) loss-of-function islets provide a further experimental model to specifically study gap-junction mediated suppression of electrical activity. In isolated β-cells or Cx36(-/-) islets, elevations in [Ca(2+)](i) persisted in a subset of cells even at basal glucose. Isolated β-cells showed elevated insulin secretion at basal glucose; however, insulin secretion from Cx36(-/-) islets was minimally altered. [Ca(2+)](i) was further elevated under basal conditions, but insulin release still suppressed in K(ATP) loss-of-function islets. Forced elevation of cAMP led to PKA-mediated increases in insulin secretion from islets lacking gap-junctions, but not from islets expressing Cx36 gap junctions. We conclude there is a redundancy in how cell-cell communication in the islet suppresses insulin release. Gap junctions suppress cellular heterogeneity and spontaneous [Ca(2+)](i) signals, while other juxtacrine mechanisms, regulated by PKA and glucose, suppress more distal steps in exocytosis. Each mechanism is sufficiently robust to compensate for a loss of the other and still suppress basal insulin secretion.


Figures

Figure 7
Figure 7. How multiple cell–cell communication mechanisms regulate basal insulin release
A, two representative cells in an islet have different threshold for glucose activation of Ca2+-signalling, either intrinsic to the cell as illustrated here, or induced by mosaic Kir6.2[AAA] expression. At basal glucose levels, one cell (upper, dark grey) has reduced KATP channel activity making it more excitable. The other cell (lower, light grey) has increased KATP channel activity making it less excitable. Cx36 gap junction coupling mediates a hyperpolarizing current (IK) to the more excitable cell, preventing transient depolarization and voltage-gated calcium channel activation. This suppresses any [Ca2+]i elevations and Ca2+ triggering of insulin secretion in the more excitable cell. More distal, other juxtacrine mechanisms (‘Juxtacrine’) putatively including EphA forward signalling and NCAM signalling also suppress insulin granule trafficking and/or exocytosis to additionally suppress insulin secretion. B, in the absence of gap junctions, the more excitable cell depolarizes and elevates [Ca2+]i, but an elevation in insulin secretion is still blocked downstream of Ca2+ signalling, dependent on other juxtacrine mechanisms. C, cAMP acting via PKA overcomes the effect of other suppressive juxtacrine mechanisms, but in the presence of gap junction coupling a suppression of any [Ca2+]i elevation prevents an elevation in insulin secretion. D, only when gap junction coupling is inhibited and other juxtacrine mechanisms are overcome by cAMP via PKA do more excitable cell show elevated Ca2+-triggering and elevated basal insulin secretion as in isolated cells.
Figure 1
Figure 1. Glucose-dependent [Ca2+]i in Cx36−/− islets
A, mean coupling conductance of peripheral islet β-cells during single-cell current and voltage clamp recording. Measurements were made in islets isolated from Cx36+/+, Cx36+/− and Cx36−/− mice, from 3 mice for each group. B, mean percentage of cells displaying dynamic changes in [Ca2+]i as a function of glucose stimulation for intact Cx36+/+ islets (filled squares) and Cx36−/− islets (open squares). Data averaged over n = 5 mice. **Significant difference of P < 0.01 (Student's unpaired t test) at each glucose concentration comparing intact Cx36+/+ and Cx36−/− islet data. C, mean [Ca2+]i as a function of glucose stimulation for intact Cx36+/+ islets (filled bars) and Cx36−/− islets (open bars). Data averaged over n = 7 mice. *Significant difference of P < 0.05 (Student's paired t test) comparing each experimental group as indicated. D, representative time courses of [Ca2+]i at 5.5 mm glucose, as measured from Fluo4 fluorescence, for a number of non-adjacent cells (numbered) from a single Cx36+/+, Cx36+/− and Cx36−/− islet as indicated. Time courses are offset for clarity and vertical scale bar indicates 2-fold change in Fluo4 fluorescence. Time course 1 in Cx36+/+ (in grey) represents a cell showing no activity at elevated glucose and therefore classified as an α-cell. E, mean percentage of cells displaying dynamic changes in [Ca2+]i as a function of glucose stimulation for intact wild-type islets (black squares) and dissociated wild-type cells (grey triangles). Data averaged over n = 3 mice. **Significant difference of P < 0.01 (Student's unpaired t test) at each glucose concentration comparing intact islet and dissociated cell data. The difference in means ± 95% confidence interval for C is shown in Fig. S2A.
Figure 2
Figure 2. NAD(P)H response in Cx36−/− islets
A, normalized (norm.) increase in NAD(P)H autofluorescence as a function of glucose stimulation, for islets isolated from Cx36+/+ (filled squares) and Cx36−/− mice (open squares). Data normalized to the level of NAD(P)H at 2 and 15 mm glucose. A Hill-curve fit is included for each group of data (continuous and dashed line, respectively). B, level of NAD(P)H autofluorescence in arbitrary units (a.u.) at 2 mm glucose and 15 mm glucose in Cx36+/+, Cx36+/− and Cx36−/− islets. Data averaged over n = 4 mice for each group.
Figure 3
Figure 3. Insulin secretion in Cx36−/− islets and dissociated β-cells
A, glucose-stimulated insulin secretion from isolated islets of Cx36+/+ (black squares), Cx36+/− (grey squares), Cx36−/− (open squares) mice. B, insulin content of Cx36+/+, Cx36+/− and Cx36−/− islets. Data in A and B averaged over n = 7 mice for each group. C, mean fold-increase in insulin secretion between 2 mm and 20 mm glucose stimulation for intact Cx36+/+ and Cx36−/− islets and dissociated (disp.) Cx36+/+ and Cx36−/−β-cells. *Significant difference of P < 0.05 (Student's paired t test) comparing each experimental group as indicated. D, glucose-stimulated insulin secretion from intact Cx36+/+ islets (black squares) and dissociated Cx36+/+β-cells (grey triangles), displayed as fractional insulin secretion per hour normalized by insulin content. E, glucose-stimulated insulin secretion from intact Cx36−/− islets (open squares) and dissociated Cx36−/−β-cells (open triangles). Measurements for all groups in C, D and E made in parallel experiments, averaged over n = 11 littermate Cx36+/+ and Cx36−/− mice for each group. *Significant difference of P < 0.05 (Student's paired t test) at each glucose concentration comparing intact islet and dissociated cell data. The difference in means ± 95% confidence interval for D and E is shown in Fig. S2B.
Figure 4
Figure 4. Gap junction-dependent [Ca2+]i in Kir6.2[AAA] islets
A, mean percentage of cells displaying dynamic changes in [Ca2+]i as a function of glucose stimulation, for islets isolated from Kir6.2[AAA]:Cx36+/+ (black squares), Kir6.2[AAA]:Cx36−/− (open squares), Kir6.2[WT]:Cx36+/+ (wild-type, grey diamonds) mice. Data averaged over n = 5 mice. **Significant difference of P < 0.01 (Student's unpaired t test) at each glucose concentration comparing Kir6.2[AAA]:Cx36+/+ and Kir6.2[AAA]:Cx36−/− data. B, mean percentage of islet cells displaying dynamic changes in [Ca2+]i at 2 mm glucose, for intact Kir6.2[WT]:Cx36+/+ (hatched), Kir6.2[AAA]:Cx36+/+ (black), Kir6.2[AAA]:Cx36+/− (grey), and Kir6.2[AAA]:Cx36−/− (white) islets. Data averaged over n = 6 mice. *Significant difference of P < 0.05 and ‘ns’, non-significant difference (P > 0.05), comparing each experimental group as indicated. C, mean [Ca2+]i concentration as a function of glucose stimulation for intact Kir6.2[AAA]:Cx36+/+ islets (black bars) and Kir6.2[AAA]:Cx36−/− islets (white bars). Data averaged over n = 3 mice. *Significant difference of P < 0.05 (Student's paired t test) comparing each experimental group as indicated. D, mean percentage of cells, dissociated from Kir6.2[AAA]:Cx36+/+ islets, displaying dynamic changes in [Ca2+]i as a function of glucose stimulation for GFP positive cells (open triangles) and GFP negative cells (grey triangles). E, as in D for cells dissociated from Kir6.2[AAA]:Cx36−/− islets. Data in D and E averaged over n = 4 experiments, from 2 mice. *Significant difference of P < 0.05 (Student's unpaired t test) at each glucose concentration comparing GFP positive and GFP negative cells.
Figure 5
Figure 5. Insulin secretion in Kir6.2[AAA]:Cx36−/− islets
A, glucose-stimulated insulin secretion from isolated islets of Kir6.2[AAA]:Cx36+/+ mice (black squares) and Kir6.2[AAA]:Cx36−/− mice (open squares). Data averaged over n = 7 mice. *Significant difference of P < 0.05 (Student's paired t test) at each glucose concentration comparing Kir6.2[AAA]:Cx36+/+ and Kir6.2[AAA]:Cx36−/− data. B, insulin secretion at 2 mm glucose, for intact Kir6.2[WT]:Cx36+/+ (hatched), Kir6.2[AAA]:Cx36+/+ (black), Kir6.2[AAA]:Cx36+/− (grey), and Kir6.2[AAA]:Cx36−/− (white) islets. Data are expressed as a percentage of insulin secretion in Kir6.2[AAA]:Cx36+/+ islets at 20 mm glucose to facilitate comparison with Fig. 4B. ‘ns’ indicates non-significant difference (P > 0.05) comparing each experimental group to Kir6.2[AAA]. C, insulin content of Kir6.2[AAA]:Cx36+/+ and Kir6.2[AAA]:Cx36−/− islets. Data averaged over n = 7 mice. D, glucose-stimulated insulin secretion from dissociated Kir6.2[AAA]:Cx36+/+ (grey triangles) and Kir6.2[AAA]:Cx36−/− (open triangles) β-cells. Displayed is the fractional insulin secretion per hour normalized by insulin content. Data averaged over n = 6 mice. The difference in means ± 95% confidence interval for A and C is shown in Fig. S2C.
Figure 6
Figure 6. Gap junction-independent regulation of insulin secretion in Cx36−/− islets
A, insulin secretion from isolated islets of Kir6.2[AAA]:Cx36+/+ (black bars) and Kir6.2[AAA]:Cx36−/− (white bars) mice. Islets were incubated at 2 mm glucose (2G), plus the cAMP raising agents IBMX and forskolin (+IBMX/Fsk, 100 μm and 50 μm, respectively), or with 20 mm glucose (20G). Data averaged over n = 5 littermate mouse pairs. B, insulin secretion from isolated islets, as in A, plus the GLP1R agonist exendin4 (100 nm). Data averaged over n = 7 littermate mouse pairs. C, insulin secretion from isolated islets as in A, plus high KCl (+KCl, +30 mm). Data averaged over n = 5 littermate mouse pairs. D, mean [Ca2+]i concentration in isolated islets, treated with 2 mm glucose alone, or plus IBMX and forskolin, exendin4 (+Ex4), or high KCl, as in AC. Data averaged over n = 3 mice. E, insulin secretion from isolated islets of Cx36+/+ (black bars), Cx36+/− (grey bars), Cx36−/− (white bars) mice, incubated at 2 mm or 5.5 mm glucose alone (2G, 5G), plus IBMX and forskolin (+IBMX/Fsk, 100 μm and 50 μm, respectively), or at 20 mm glucose alone (20G). Data averaged over n = 4 littermate mice. F, insulin secretion from islets, as in A, plus either the Epac-specific cAMP analogue 8-pCPT-2-O-Me-cAMP (8-pCPT, 300 μm) or the PKA-specific cAMP analogue 6-Bnz-cAMP (6-Bnz, 300 μm). Data averaged over n = 7 littermate mice pairs. G, insulin secretion from isolated islets of Kir6.2[AAA]:Cx36−/− mice incubated at 2 mm glucose plus exendin4 alone (Ex4, 100 nm) or exendin4 plus either the Epac inhibitor brefeldin A (BFA, 100 μm), the PKA antagonist H89 (10 μm) or the specific PKA antagonist Rp-cAMP (100 μm). Data averaged over n = 8 mice. *Significant difference of P < 0.05, ***significant difference of P < 0.001, ‘ns’, non-significant difference (P > 0.05) (Student's paired t test), comparing each experimental group as indicated, or compared to 2 mm glucose alone (in D and F indicated within the bar).

References

    1. Asa SL, Tannenbaum GS. Cell-cell communication in the pituitary: orchestrator of pulsatile growth hormone secretion? Trends Endocrinol Metab. 2006;17:299–300. - PubMed
    1. Bennett BD, Jetton TL, Ying GT, Magnuson MA, Piston DW. Quantitative subcellular imaging of glucose metabolism within intact pancreatic islets. J Biol Chem. 1996;271:3647–3651. - PubMed
    1. Benninger RKP, Remedi MS, Head WS, Ustione A, Piston DW, Nichols CG. Defects in β-cell Ca2+ signalling, glucose metabolism and insulin secretion in a murine model of KATP channel-induced neonatal diabetes mellitus. Diabetologia. 2011;54:1087–1097. - PMC - PubMed
    1. Benninger RKP, Zhang M, Head WS, Satin LS, Piston DW. Gap junction coupling and calcium waves in the pancreatic islet. Biophys J. 2008;95:5048–5061. - PMC - PubMed
    1. Bonnefont X, Lacampagne A, Sanchez-Hormigo A, Fino E, Creff A, Mathieu MN, Smallwood S, Carmignac D, Fontanaud P, Travo P, Alonso G, Courtois-Coutry N, Pincus SM, Robinson I, Mollard P. Revealing the large-scale network organization of growth hormone-secreting cells. Proc Natl Acad Sci U S A. 2005;102:16880–16885. - PMC - PubMed

Publication types