. 2011 Nov 4;286(44):37964-37975.
doi: 10.1074/jbc.M111.285312. Epub 2011 Sep 19.

Induction of lectin-like transcript 1 (LLT1) protein cell surface expression by pathogens and interferon-γ contributes to modulate immune responses

Affiliations

Induction of lectin-like transcript 1 (LLT1) protein cell surface expression by pathogens and interferon-γ contributes to modulate immune responses

Claire Germain et al. J Biol Chem. .

Abstract

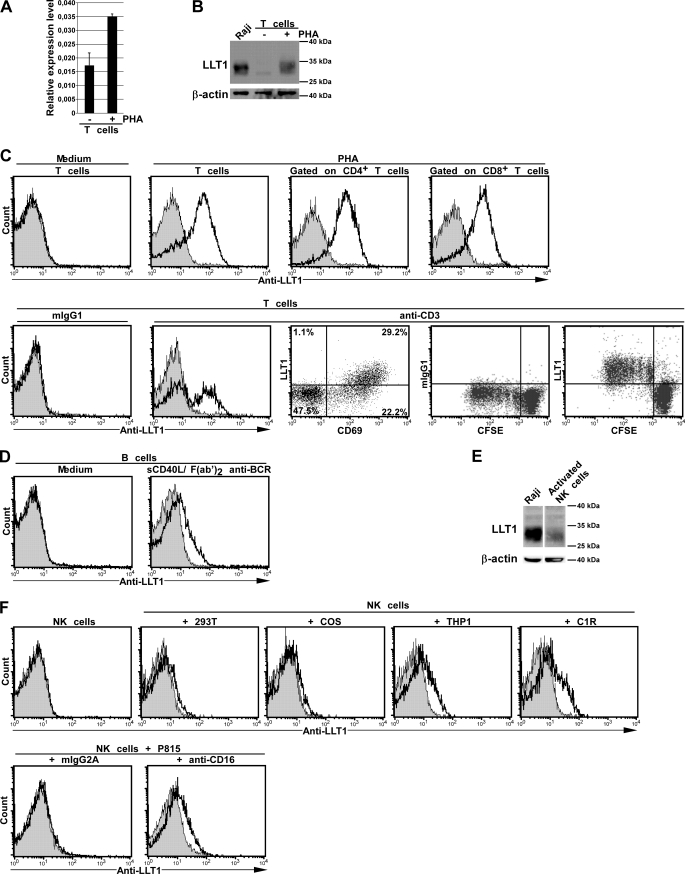
CD161 is a C-type lectin-like receptor expressed on human natural killer (NK) cells and subsets of T cells. CD161 has been described as an inhibitory receptor that regulates NK cell-mediated cytotoxicity and IFN-γ production. Its role on T cells has remained unclear. Studies have shown that triggering of CD161 enhances NK T cell proliferation and T cell-IFN-γ production while inhibiting TNF-α production by CD8(+) T cells. Lectin-like transcript 1 (LLT1), the ligand of CD161, was found to be expressed on Toll-like receptor (TLR)-activated plasmacytoid and monocyte-derived dendritic cells (DC) and on activated B cells. Using newly developed anti-LLT1 mAbs, we show that LLT1 is not expressed on the surface of circulating B and T lymphocytes, NK cells, monocytes, and dendritic cells but that LLT1 is up-regulated upon activation. Not only TLR-stimulated dendritic cells and B cells but also T cell receptor-activated T cells and activated NK cells up-regulate LLT1. Interestingly, IFN-γ increases LLT1 expression level on antigen-presenting cells. LLT1 is also induced on B cells upon viral infection such as Epstein-Barr virus or HIV infection and in inflamed tonsils. Finally, expression of LLT1 on B cells inhibits NK cell function but costimulates T cell proliferation or IFN-γ production, and coengagement of CD161 with CD3 increases IL-17 secretion. Altogether, our results point toward a role for LLT1/CD161 in modulating immune responses to pathogens.


Figures

FIGURE 1.
FIGURE 1.
LLT1 expression in resting PBMCs. A, CLEC2D transcript variant 1 (LLT1) quantification by real-time RT-PCR in Raji or the indicated cell populations isolated from peripheral blood of a representative healthy donor. B, LLT1 protein detection by Western blot analysis of whole cell lysates of the indicated cell populations using 2F1 mAb. β-Actin was used as internal control. C, cell surface expression of LLT1 analyzed by flow cytometry using 4F68 mAb (solid line) compared with mIgG1 isotype control (filled histogram). Data are representative of three independent experiments (A and B) and >20 independent experiments (C).
FIGURE 2.
FIGURE 2.
LLT1 expression is induced on activated lymphocytes. A–C, polyclonal T cells cultured for 72 h in the absence or presence of PHA or 24 h on plate-bound anti-CD3. CFSE-labeled CD4+ T cells were cultured for 5 days on plate-bound anti-CD3. A, CLEC2D transcript variant 1 (LLT1) quantification by real-time RT-PCR. B and E, LLT1 protein detection by Western blot analysis of whole cell lysates using 2F1 mAb. Raji was used as control, and β-actin was used as internal control. NK cells were generated from allogeneic stimulation in the presence of IL-2. C, D, and F, cell surface expression of LLT1 analyzed by flow cytometry using 4F68 mAb (solid line) compared with mIgG1 isotype control (filled histogram). C, on T cells following PHA (upper) or plate-bound anti-CD3 (lower) stimulation. The proportions of plate-bound anti-CD3 activated T cells expressing LLT1 and CD69 are indicated. LLT1 expression is measured on CFSE-labeled CD4+ T cells. D, on polyclonal B cells cultured for 60 h in the absence or presence of sCD40L and anti-BCR F(ab′)2 fragments. F, on polyclonal NK cells cultured for 18 h in the absence or presence of the indicated target cells (upper) and in the presence of P815 cells coated with mIgG2a isotype control or anti-CD16 mAb (lower). Data are representative of at least three independent experiments.
FIGURE 3.
FIGURE 3.
LLT1 is induced on LPS-matured DCs. A, CLEC2D transcript variant 1 (LLT1) quantification by real-time RT-PCR in immature DCs or DCs matured with the indicated stimuli. B and C, LLT1 protein detection by Western blot analysis of whole cell lysates using 2F1 mAb. C1R-LLT1 was used as control,. and β-actin was used as internal control. D and E, cell surface expression of LLT1 analyzed by flow cytometry using 4F68 mAb (solid line) compared with mIgG1 isotype control (filled histogram). The proportion of LLT1-expressing DCs among total DCs is indicated. Data are representative of at least three independent experiments (A, D, and E) and two independent experiments (B and C).
FIGURE 4.
FIGURE 4.
LLT1 expression is induced on activated B cells. A, CLEC2D transcript variant 1 (LLT1) quantification by real-time RT-PCR in purified peripheral B cells stimulated or not for 38 h with the TLR7/8 ligand CL097. B, LLT1 protein detection by Western blot analysis of whole cell lysates using 2F1 mAb following 60 h of stimulation. Raji was used as positive control and β-actin as internal control. C and D, cell surface expression of LLT1 analyzed by flow cytometry using 4F68 mAb (solid line) compared with mIgG1 isotype control (filled histogram) following 60 h of stimulation. D, proportion of LLT1-expressing B cells among total B cells. E and F, cell surface expression of LLT1 on CD19+CD3 gated B cells, analyzed by flow cytometry using 4F68 mAb (solid line) compared with mIgG1 isotype control (filled histogram) E, following in vitro infection of PBMCs with EBV or HIV. F, in human inflamed tonsils in combination with CD38. Data are representative of at least three independent experiments (A, C, and F) and two independent experiments (B, D, and E).
FIGURE 5.
FIGURE 5.
Anti-LLT1 mAb 4F68 blocks LLT1/CD161 interaction and restores NK cell functions. A, 293T-CD161 cells were stained with LLT1-Fc multimer in the presence of increasing concentrations of anti-LLT1 4F68 mAb (filled circles) or mIgG1 isotype control (open circles). Results are shown as mean ± S.E. (error bars) of four experiments. B, cell surface expression of CD161 analyzed by flow cytometry using 191B8 mAb on NK cells incubated alone or with C1R or C1R-LLT1 in the presence or absence of the indicated anti-LLT1 mAbs and isotype control mIgG1. The mean fluorescence intensity obtained with NK cells alone was arbitrarily set as 100%. Data are mean ± S.D. of triplicates and are representative of five experiments. C and D, NK cell degranulation (left) and NK cell secretion of IFN-γ (right) following incubation with C1R or C1R-LLT1 targets in the presence of the indicated mIgG1 (C), or the indicated F(ab′)2 fragments and hIgG4-Fc chimeric molecules (D). The percentage of CD107a+ and IFN-γ+ NK cells in the presence of C1R cells was arbitrarily set as 100%. Average and S.D. of three (C) and two (D) independent experiments with triplicates are indicated.
FIGURE 6.
FIGURE 6.
LLT1 expressed on B cells costimulates T cells. A, IFN-γ secretion by T cells stimulated with SEB and autologous B cells expressing LLT1 following CpG stimulation, in the presence of the indicated isotype controls or anti-LLT1 mAbs. The percentage of IFN-γ+ and IFN-γhigh CD161+ T cells is indicated on the dot-plots and graphically. B, CD56-depleted human tonsillar cells labeled with CFSE incubated with SEB in the presence of the indicated mAbs or hIgG4-Fc chimeric molecules. The percentage of proliferative CD3+CD161+ T cells is indicated. C, IL-17 secretion by a representative CD4+CD161+ Th17 clone stimulated by increasing concentrations of plate-bound anti-CD3, in the presence of a saturating concentration of plate-bound isotype control or anti-CD161 mAb. Results are expressed as a percentage of IL-17 secretion index calculated as follows: (percentage IL-17+ cells with anti-CD161 − percentage IL-17+ cells with isotype control mIgG1)/(percentage IL-17+ cells with isotype control mIgG1) * 100. Data are representative of two independent experiments.

References

    1. Palm N. W., Medzhitov R. (2009) Immunol. Rev. 227, 221–233 - PubMed
    1. Lanier L. L., Chang C., Phillips J. H. (1994) J. Immunol. 153, 2417–2428 - PubMed
    1. Exley M., Porcelli S., Furman M., Garcia J., Balk S. (1998) J. Exp. Med. 188, 867–876 - PMC - PubMed
    1. Martin E., Treiner E., Duban L., Guerri L., Laude H., Toly C., Premel V., Devys A., Moura I. C., Tilloy F., Cherif S., Vera G., Latour S., Soudais C., Lantz O. (2009) PLoS Biol. 7, e54 - PMC - PubMed
    1. Poggi A., Zocchi M. R., Costa P., Ferrero E., Borsellino G., Placido R., Galgani S., Salvetti M., Gasperini C., Ristori G., Brosnan C. F., Battistini L. (1999) J. Immunol. 162, 4349–4354 - PubMed

Publication types