

RNA-binding site of Escherichia coli peptidyl-tRNA hydrolase
- PMID: 21930710
- PMCID: PMC3234781
- DOI: 10.1074/jbc.M111.281840
RNA-binding site of Escherichia coli peptidyl-tRNA hydrolase
Abstract
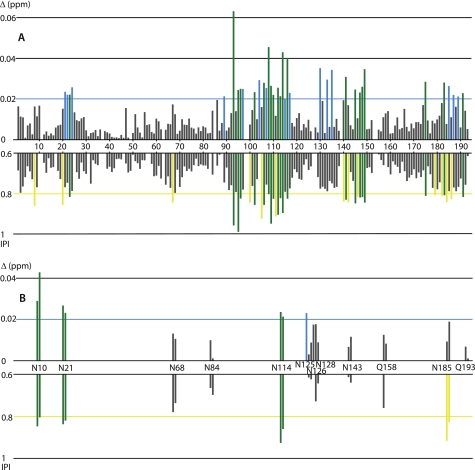
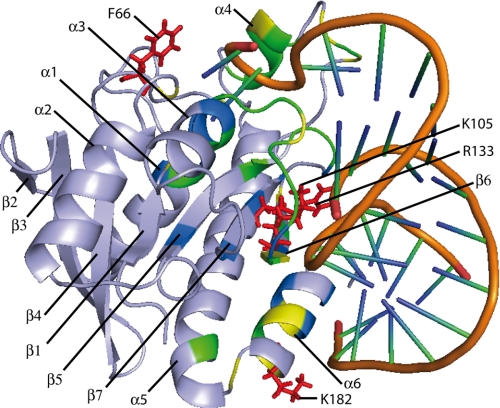
In a cell, peptidyl-tRNA molecules that have prematurely dissociated from ribosomes need to be recycled. This work is achieved by an enzyme called peptidyl-tRNA hydrolase. To characterize the RNA-binding site of Escherichia coli peptidyl-tRNA hydrolase, minimalist substrates inspired from tRNA(His) have been designed and produced. Two minisubstrates consist of an N-blocked histidylated RNA minihelix or a small RNA duplex mimicking the acceptor and TψC stem regions of tRNA(His). Catalytic efficiency of the hydrolase toward these two substrates is reduced by factors of 2 and 6, respectively, if compared with N-acetyl-histidyl-tRNA(His). In contrast, with an N-blocked histidylated microhelix or a tetraloop missing the TψC arm, efficiency of the hydrolase is reduced 20-fold. NMR mapping of complex formation between the hydrolase and the small RNA duplex indicates amino acid residues sensitive to RNA binding in the following: (i) the enzyme active site region; (ii) the helix-loop covering the active site; (iii) the region including Leu-95 and the bordering residues 111-117, supposed to form the boundary between the tRNA core and the peptidyl-CCA moiety-binding sites; (iv) the region including Lys-105 and Arg-133, two residues that are considered able to clamp the 5'-phosphate of tRNA, and (v) the positively charged C-terminal helix (residues 180-193). Functional value of these interactions is assessed taking into account the catalytic properties of various engineered protein variants, including one in which the C-terminal helix was simply subtracted. A strong role of Lys-182 in helix binding to the substrate is indicated.
Figures


Similar articles
-
NMR-based substrate analog docking to Escherichia coli peptidyl-tRNA hydrolase.J Mol Biol. 2011 Sep 30;412(4):619-33. doi: 10.1016/j.jmb.2011.06.025. Epub 2011 Jun 21. J Mol Biol. 2011. PMID: 21718701
-
Structural basis for the substrate recognition and catalysis of peptidyl-tRNA hydrolase.Nucleic Acids Res. 2012 Nov 1;40(20):10521-31. doi: 10.1093/nar/gks790. Epub 2012 Aug 25. Nucleic Acids Res. 2012. PMID: 22923517 Free PMC article.
-
A physiological connection between tmRNA and peptidyl-tRNA hydrolase functions in Escherichia coli.Nucleic Acids Res. 2004 Nov 16;32(20):6028-37. doi: 10.1093/nar/gkh924. Print 2004. Nucleic Acids Res. 2004. PMID: 15547251 Free PMC article.
-
[tRNA-binding centers of Escherichia coli ribosomes and their structural organization].Mol Biol (Mosk). 1984 Sep-Oct;18(5):1194-207. Mol Biol (Mosk). 1984. PMID: 6209546 Review. Russian.
-
Unveiling the Druggable Landscape of Bacterial Peptidyl tRNA Hydrolase: Insights into Structure, Function, and Therapeutic Potential.Biomolecules. 2024 Jun 7;14(6):668. doi: 10.3390/biom14060668. Biomolecules. 2024. PMID: 38927071 Free PMC article. Review.
Cited by
-
Crystallization and preliminary X-ray analysis of peptidyl-tRNA hydrolase from Thermus thermophilus HB8.Acta Crystallogr Sect F Struct Biol Cryst Commun. 2013 Mar 1;69(Pt 3):332-5. doi: 10.1107/S1744309113003424. Epub 2013 Feb 27. Acta Crystallogr Sect F Struct Biol Cryst Commun. 2013. PMID: 23519816 Free PMC article.
-
Small Molecule Docking Supports Broad and Narrow Spectrum Potential for the Inhibition of the Novel Antibiotic Target Bacterial Pth1.Antibiotics (Basel). 2016 May 10;5(2):16. doi: 10.3390/antibiotics5020016. Antibiotics (Basel). 2016. PMID: 27171117 Free PMC article.
-
Coarse-grain simulations on NMR conformational ensembles highlight functional residues in proteins.J R Soc Interface. 2019 Jul 26;16(156):20190075. doi: 10.1098/rsif.2019.0075. Epub 2019 Jul 10. J R Soc Interface. 2019. PMID: 31288649 Free PMC article.
-
Expedited isolation of natural product peptidyl-tRNA hydrolase inhibitors from a Pth1 affinity column.AIMS Mol Sci. 2017;4(2):175-184. doi: 10.3934/molsci.2017.2.175. Epub 2017 May 12. AIMS Mol Sci. 2017. PMID: 30740515 Free PMC article.
-
Binding mode between peptidyl-tRNA hydrolase and the peptidyl-A76 moiety of the substrate.J Biol Chem. 2025 Apr;301(4):108385. doi: 10.1016/j.jbc.2025.108385. Epub 2025 Mar 4. J Biol Chem. 2025. PMID: 40049414 Free PMC article.
References
-
- Atherly A. G., Menninger J. R. (1972) Nat. New Biol. 240, 245–246 - PubMed
-
- Menez J., Buckingham R. H., de Zamaroczy M., Campelli C. K. (2002) Mol. Microbiol. 45, 123–129 - PubMed
-
- Sassetti C. M., Boyd D. H., Rubin E. J. (2003) Mol. Microbiol. 48, 77–84 - PubMed
-
- Kössel H., RajBhandary U. L. (1968) J. Mol. Biol. 35, 539–560 - PubMed
MeSH terms
Substances
LinkOut - more resources
Full Text Sources
