. 2011 Nov 11;286(45):39059-71.
doi: 10.1074/jbc.M111.221689. Epub 2011 Sep 19.

Ectonucleotide pyrophosphatase/phosphodiesterase-1 (ENPP1) protein regulates osteoblast differentiation

Affiliations

Ectonucleotide pyrophosphatase/phosphodiesterase-1 (ENPP1) protein regulates osteoblast differentiation

Hwa Kyung Nam et al. J Biol Chem. .

Abstract

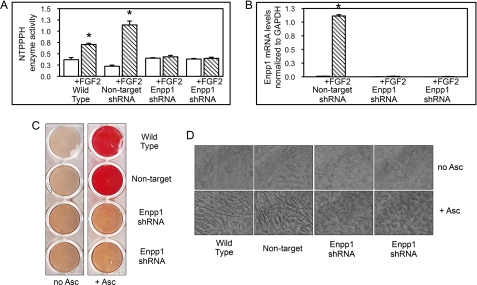
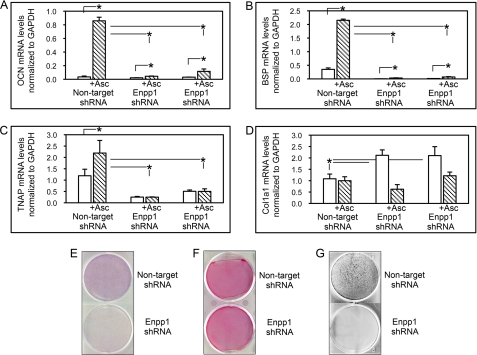
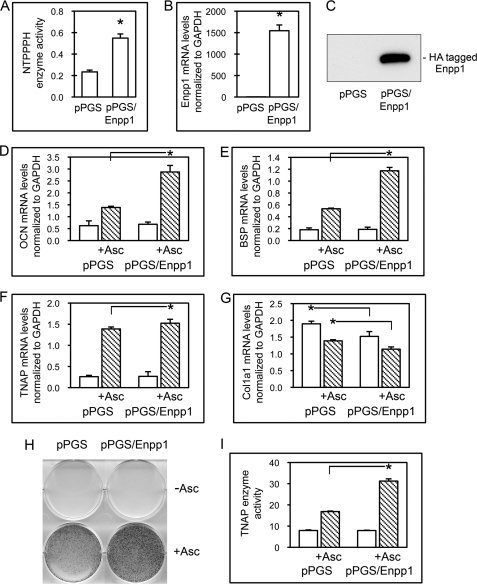
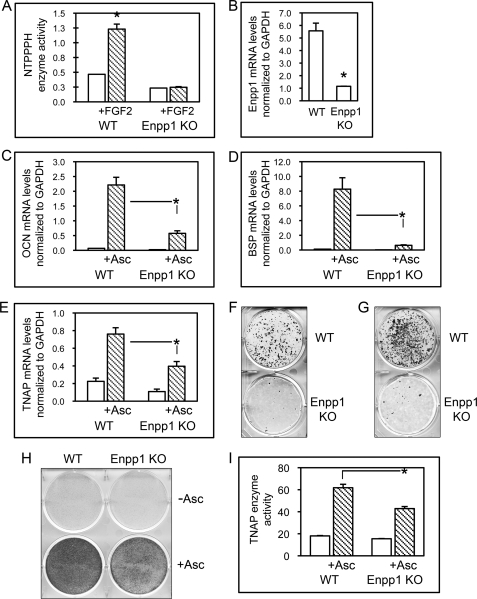
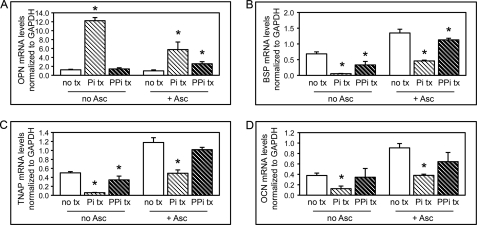
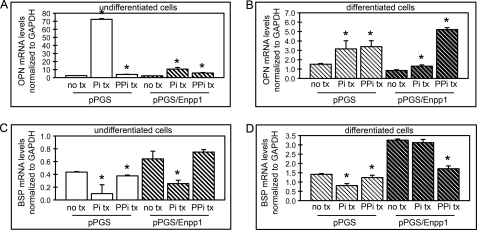
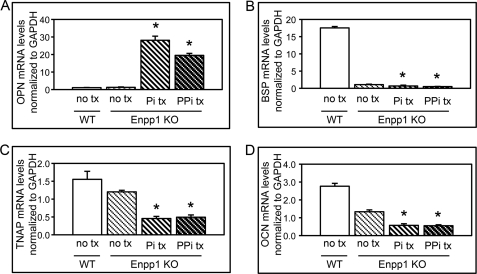
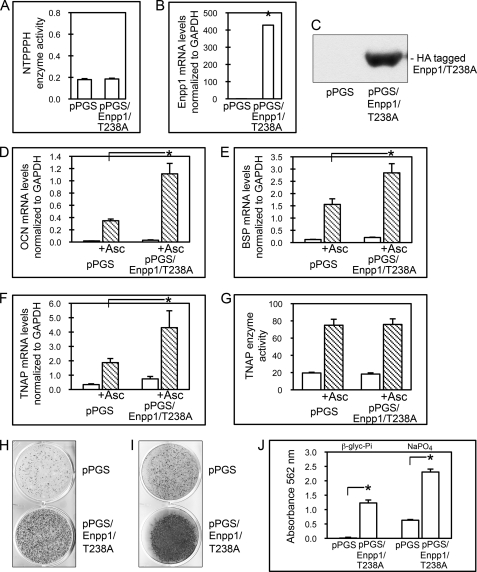
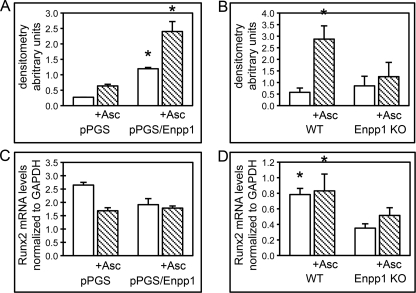
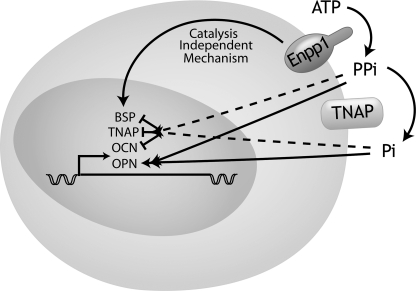
ENPP1 (ectonucleotide pyrophosphatase/phosphodiesterase-1) is an established regulator of tissue mineralization. Previous studies demonstrated that ENPP1 is expressed in differentiated osteoblasts and that ENPP1 influences matrix mineralization by increasing extracellular levels of inorganic pyrophosphate. ENPP1 is also expressed in osteoblastic precursor cells when stimulated with FGF2, but the role of ENPP1 in preosteoblastic and other precursor cells is unknown. Here we investigate the function of ENPP1 in preosteoblasts. We find that ENPP1 expression is critical for osteoblastic differentiation and that this effect is not mediated by changes in extracellular concentration levels of phosphate or pyrophosphate or ENPP1 catalytic activity. MC3T3E1(C4) preosteoblastic cells, in which ENPP1 expression was suppressed by ENPP1-specific shRNA, and calvarial cells isolated from Enpp1 knock-out mice show defective osteoblastic differentiation upon stimulation with ascorbate, as indicated by a lack of cellular morphological change, a lack of osteoblast marker gene expression, and an inability to mineralize matrix. Additionally, MC3T3E1(C4) cells, in which wild type or catalytic inactive ENPP1 expression was increased, exhibited an increased tendency to differentiate, as evidenced by increased osteoblast marker gene expression and increased mineralization. Notably, treatment of cells with inorganic phosphate or pyrophosphate inhibited, as opposed to enhanced, expression of multiple genes that are expressed in association with osteoblast differentiation, matrix deposition, and mineralization. Our results indicate that ENPP1 plays multiple and distinct roles in the development of mineralized tissues and that the influence of ENPP1 on osteoblast differentiation and gene expression may include a mechanism that is independent of its catalytic activity.


Figures

FIGURE 1.
FIGURE 1.
ENPP1 expression is required for ascorbate induced mineralization and cellular morphological changes. A, Enpp1 shRNA suppresses FGF2-induced ENPP1 enzyme activity. NTPPPH enzyme activity (indicative of ENPP1 enzyme activity) was analyzed in wild type MC3T3E1(C4) calvarial preosteoblasts, MC3T3E1(C4) cells expressing non-target shRNA, and two MC3T3E1(C4) cell clones expressing Enpp1-specific shRNA. Cells were treated with FGF2 to induce ENPP1 expression. NTPPPH activity was measured by incubation of cell lysate with a colorimetric substrate. *, p < 0.05 versus no FGF2. B, Enpp1 shRNA suppresses FGF2-induced Enpp1 mRNA expression. Cells expressing non-target or Enpp1-specific shRNA were treated with FGF2 to induce ENPP1 expression. Enpp1 mRNA was measured by real-time PCR. Results are presented as normalized to GAPDH. *, p < 0.05 versus no FGF2. C, ENPP1-deficient cells have a defect in matrix mineralization. Wild type, non-target shRNA and Enpp1-specific shRNA-expressing cells were cultured in medium with ascorbate and β-glycerophosphate. Mineralized matrix was stained with Alizarin Red. D, ascorbate does not induce cellular morphological changes in ENPP1-deficient cells. Wild type, non-target shRNA and Enpp1-specific shRNA-expressing cells were cultured in medium with or without ascorbate. Live cells were photographed at ×20 magnification. Error bars, S.D.
FIGURE 2.
FIGURE 2.
Enpp1 shRNA-expressing cells do not undergo osteoblast differentiation upon stimulation with ascorbate. A–D, ascorbate treatment does not stimulate osteoblastic gene expression in ENPP1-deficient cells. MC3T3E1(C4) cells expressing non-target shRNA and two MC3T3E1(C4) cell clones expressing Enpp1-specific shRNA were cultured with or without ascorbate to induce osteoblast differentiation. OCN, BSP, TNAP, and Col1a1 mRNA levels were measured by real-time PCR. Results are presented as normalized to GAPDH. *, p < 0.05 between the indicated groups. E, ascorbate treatment does not stimulate TNAP enzyme activity in ENPP1-deficient cells. Cells expressing non-target or Enpp1-specific shRNA were cultured with ascorbate, and TNAP enzyme activity was assayed by incubation with a colorimetric substrate. F, ENPP1-deficient cells produce similar amounts of collagenous matrix. MC3T3E1(C4) cells expressing non-target or Enpp1-specific shRNA were cultured with ascorbate, and collagen was stained with Sirius Red. G, ENPP1-deficient cells do not produce mineralized nodules in the presence of inorganic phosphate. Non-target shRNA and Enpp1-specific shRNA expressing MC3T3E1(C4) cells were cultured in medium containing ascorbate and Na2HPO4. Mineralized matrix was stained by Von Kossa. Error bars, S.D.
FIGURE 3.
FIGURE 3.
Overexpression of ENPP1 promotes expression of genes associated with osteoblast differentiation. A, MC3T3E1(C4) cells transduced with Enpp1 cDNA exhibit high ENPP1 enzyme activity. NTPPPH enzyme activity was analyzed in cells stably expressing a control vector (pPGS) or an Enpp1 expression vector (pPGS/Enpp1) by incubation of cell lysate with a colorimetric substrate. *, p < 0.05 versus pPGS cells. B, cells transduced with Enpp1 cDNA express high levels of Enpp1 mRNA. Enpp1 mRNA was measured by real-time PCR. Results are presented as normalized to GAPDH. *, p < 0.05 versus pPGS cells. C, cells transduced with Enpp1 cDNA express HA-tagged ENPP1. ENPP1 protein was assayed by immunoblotting for HA-tagged ENPP1. D–G, ENPP1-overexpressing cells show enhanced expression of osteoblastic genes. Cells were cultured with or without ascorbate to induce osteoblast differentiation. OCN, BSP, TNAP, and Col1a1 mRNA levels were measured by real-time PCR. Results are presented as normalized to GAPDH. *, p < 0.05 between the indicated groups. H and I, ENPP1-overexpressing MC3T3E1(C4) cells exhibit increased TNAP enzyme activity. Cells were cultured with or without ascorbate, and TNAP enzyme activity was visualized by incubation of cells with a colorimetric substrate. TNAP enzyme activity was quantified by densitometry. Results are shown as means ± S.D. (error bars) of triplicate experiments. *, p < 0.05 between indicated groups.
FIGURE 4.
FIGURE 4.
Calvarial cells isolated from ENPP1 knock-out mice exhibit diminished osteoblast differentiation. A, calvarial cells from ENPP1 knock-out mice show diminished ENPP1 enzyme activity. Cells were treated with FGF2 to induce ENPP1 expression. NTPPPH activity was measured by incubation of cell lysate with a colorimetric substrate. *, p < 0.05 versus no treatment. B, calvarial cells from ENPP1 knock-out mice show diminished Enpp1 mRNA expression. Enpp1 mRNA was measured by real-time PCR. Results are presented as normalized to GAPDH. *, p < 0.05 versus WT. C–E, calvarial cells from ENPP1 knock-out mice show diminished osteoblastic gene expression. Primary calvarial cells were cultured with or without ascorbate. OCN, BSP, and TNAP mRNA levels were measured by real-time PCR. Results are presented as normalized to GAPDH. *, p < 0.05 between the indicated groups. F and G, calvarial cells from ENPP1 knock-out mice show diminished mineralization. Mineralized nodule formation was induced by culture of cells in medium containing ascorbate and β-glycerophosphate (F) or NaPO4 (G). Mineralized matrix was stained by Von Kossa. H and I, calvarial cells from ENPP1 knock-out mice show diminished TNAP enzyme activity. Cells were cultured with or without ascorbate, and TNAP enzyme activity was visualized by incubation of cells with a colorimetric substrate. TNAP enzyme activity was quantified by densitometry. Results are shown as means ± S.D. (error bars) of triplicate experiments. *, p < 0.05 between the indicated groups.
FIGURE 5.
FIGURE 5.
Inorganic phosphate and pyrophosphate regulate osteoblastic gene expression. A–D, wild type MC3T3E1(C4) cells were cultured with or without ascorbate and with or without inorganic phosphate (Pi) or inorganic pyrophosphate (PPi). OCN, BSP, TNAP, and Col1a1 mRNA levels were measured by real-time PCR. Results are presented as normalized to GAPDH. *, p < 0.05 versus no phosphate or pyrophosphate treatment (no tx). Error bars, S.D.
FIGURE 6.
FIGURE 6.
Inorganic phosphate and pyrophosphate regulate osteoblastic gene expression in control and ENPP1-overexpressing cells. A–D, control cells (pPGS) or cells overexpressing ENPP1 (pPGS/Enpp1) were cultured in the absence (undifferentiated cells) or presence of ascorbate (differentiated cells) and treated with or without inorganic phosphate (Pi) or inorganic pyrophosphate (PPi). OCN and BSP mRNA levels were measured by real-time PCR. Results are presented as normalized to GAPDH. *, p < 0.05 versus no phosphate or pyrophosphate treatment (no tx). Error bars, S.D.
FIGURE 7.
FIGURE 7.
Inorganic phosphate and pyrophosphate do not increase osteoblastic gene expression in primary calvarial cells isolated from ENPP1 knock-out mice. A–D, wild type (WT) and ENPP1 knock-out cells (Enpp1 KO) were cultured in the presence of ascorbate and treated with or without inorganic phosphate (Pi) or inorganic pyrophosphate (PPi). OPN, BSP, TNAP, and OCN mRNA levels were measured by real time PCR. Results are presented as normalized to GAPDH. *, p < 0.05 versus no phosphate or pyrophosphate treatment (no tx). Error bars, S.D.
FIGURE 8.
FIGURE 8.
Overexpression of catalytic inactive ENPP1 (Enpp1/T238A) enhances osteoblast differentiation. A, MC3T3E1(C4) cells stably transduced with a catalytic mutant version of Enpp1 cDNA exhibit no increase in ENPP1 enzyme activity. NTPPPH enzyme activity was analyzed in MC3T3E1(C4) cells stably expressing a control vector (pPGS) or pPGS/Enpp1/T238A. NTPPPH activity was measured by incubation of cell lysate with a colorimetric substrate. B, MC3T3E1(C4) cells transduced with Enpp1/T238A cDNA express high levels of Enpp1 mRNA. Enpp1 mRNA was measured in pPGS and pPGS/Enpp1/T238A cells by real-time PCR. Results are presented as normalized to GAPDH. *, p < 0.05 versus pPGS cells. C, MC3T3E1(C4) cells transduced with Enpp1/T238A cDNA express HA-tagged ENPP1. HA-tagged ENPP1 protein was assayed by immunoblotting for HA-tagged ENPP1 protein in cell lysate of pPGS and pPGS/Enpp1/T238A cells. D–F, Enpp1/T238A-overexpressing cells show enhanced expression of osteoblastic genes. pPGS and pPGS/Enpp1/T238A cells were cultured with or without ascorbate to induce osteoblast differentiation. OCN, BSP, and TNAP mRNA levels were measured by real-time PCR. Results are presented as normalized to GAPDH. *, p < 0.05 between the indicated groups. G, cells overexpressing Enpp1/T238A do not show changes in TNAP enzyme activity. Cells were cultured with or without ascorbate, and TNAP enzyme activity was visualized by incubation of cells with a colorimetric substrate. TNAP enzyme activity was quantified by densitometry. Results are shown as means ± S.D. (error bars) of triplicate experiments. H–J, Enpp1/T238A-overexpressing cells exhibit increased matrix mineralization. pPGS- and pPGS/Enpp1/T238A-expressing cells were cultured in medium containing ascorbate and β-glycerophosphate (H and J) or Na2HPO4 (I and J). Mineralized matrix was stained by Von Kossa (H and I) or Alizarin Red (J). Alizarin matrix staining was quantified by absorbance. Results are shown as means ± S.D. of triplicate experiments. *, p < 0.05 between the indicated groups.
FIGURE 9.
FIGURE 9.
ENPP1 expression influences RUNX2 association with the BSP gene promoter. A, control transduced MC3T3E1(C4) cells (pPGS) or MC3T3E1(C4) cells overexpressing ENPP1 (pPGS/Enpp1) were cultured with or without ascorbate. Cross-linked chromatin was immunoprecipitated with RUNX2 or control IgG antibody. PCR was performed using primers generated to detect the RUNX2 binding site located within the BSP gene promoter. PCR bands were quantified by densitometry, and RUNX2 ChIP results are shown as normalized to control IgG ChIP results. *, p < 0.05 versus pPGS cells. B, wild type and ENPP1−/− primary calvarial cells were cultured with or without ascorbate, and RUNX2 ChIP was assayed as described above. *, p < 0.05 versus ENPP1−/− cells. C, pPGS and pPGS/Enpp1 cells were cultured with or without ascorbate, and Runx2 mRNA levels were measured by real-time PCR. Results are shown as normalized to GAPDH mRNA levels. D, wild type and ENPP1−/− primary cells were cultured with or without ascorbate, and Runx2 mRNA levels were measured by real-time PCR. Results are shown as normalized to GAPDH mRNA levels. *, p < 0.05 versus ENPP1−/− cells. Error bars, S.D.
FIGURE 10.
FIGURE 10.
Model of ENPP1 regulation of osteoblastic gene expression. ENPP1 colocalizes with TNAP in the plasma membrane of osteoblastic cells. ENPP1 generates extracellular inorganic pyrophosphate (PPi) through the hydrolysis of nucleotides. Inorganic pyrophosphate is hydrolyzed by TNAP to inorganic phosphate (Pi). Inorganic pyrophosphate and inorganic phosphate increase OPN gene expression but decrease BSP, OCN, and TNAP gene expression. ENPP1 increases BSP, OCN, and TNAP gene expression via a mechanism that is independent of its enzymatic generation of inorganic pyrophosphate and phosphate.

Similar articles

Cited by

References

    1. Evans W. H., Hood D. O., Gurd J. W. (1973) Biochem. J. 135, 819–826 - PMC - PubMed
    1. Terkeltaub R., Rosenbach M., Fong F., Goding J. (1994) Arthritis Rheum. 37, 934–941 - PubMed
    1. Johnson K., Moffa A., Chen Y., Pritzker K., Goding J., Terkeltaub R. (1999) J. Bone Miner. Res. 14, 883–892 - PubMed
    1. Johnson K., Vaingankar S., Chen Y., Moffa A., Goldring M. B., Sano K., Jin-Hua P., Sali A., Goding J., Terkeltaub R. (1999) Arthritis Rheum. 42, 1986–1997 - PubMed
    1. Johnson K. A., Hessle L., Vaingankar S., Wennerg C., Mauro S., Narisawa S., Goding J. W., Sano K., Millan J. L., Terkeltaub R. (2000) Am. J. Physiol. Int. Comp. Physiol. 279, R1365–R1377 - PubMed

MeSH terms