Multicenter Study
. 2012 Mar;61(3):427-38.
doi: 10.1136/gutjnl-2011-300509. Epub 2011 Sep 19.

Chemokine-driven lymphocyte infiltration: an early intratumoural event determining long-term survival in resectable hepatocellular carcinoma

Affiliations
Multicenter Study

Chemokine-driven lymphocyte infiltration: an early intratumoural event determining long-term survival in resectable hepatocellular carcinoma

Valerie Chew et al. Gut. 2012 Mar.

Abstract

Objective: Hepatocellular carcinoma (HCC) is a heterogeneous disease with poor prognosis and limited methods for predicting patient survival. The nature of the immune cells that infiltrate tumours is known to impact clinical outcome. However, the molecular events that regulate this infiltration require further understanding. Here the ability of immune genes expressed in the tumour microenvironment to predict disease progression was investigated.

Methods: Using quantitative PCR, the expression of 14 immune genes in resected tumour tissues from 57 Singaporean patients was analysed. The nearest-template prediction method was used to derive and test a prognostic signature from this training cohort. The signature was then validated in an independent cohort of 98 patients from Hong Kong and Zurich. Intratumoural components expressing these critical immune genes were identified by in situ labelling. Regulation of these genes was analysed in vitro using the HCC cell line SNU-182.

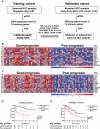
Results: The identified 14 immune-gene signature predicts patient survival in both the training cohort (p=0.0004 and HR=5.2) and the validation cohort (p=0.0051 and HR=2.5) irrespective of patient ethnicity and disease aetiology. Importantly, it predicts the survival of patients with early disease (stages I and II), for whom classical clinical parameters provide limited information. The lack of predictive power in late disease stages III and IV emphasises that a protective immune microenvironment has to be established early in order to impact disease progression significantly. This signature includes the chemokine genes CXCL10, CCL5 and CCL2, whose expression correlates with markers of T helper 1 (Th1), CD8(+) T and natural killer (NK) cells. Inflammatory cytokines (tumour necrosis factor α, interferon γ) and Toll-like receptor 3 ligands stimulate intratumoural production of these chemokines which drive tumour infiltration by T and NK cells, leading to enhanced cancer cell death.

Conclusion: A 14 immune-gene signature, which identifies molecular cues driving tumour infiltration by lymphocytes, accurately predicts survival of patients with HCC especially in early disease.


Conflict of interest statement

Competing interests: None.

Figures

Figure 1
Figure 1
Identification and validation of a 14 immune-gene signature predictive of overall survival in patients with hepatocellular carcinoma (HCC). (A) Study design for the identification of a 14 immune-gene signature derived from the training cohort (Sg, n=57) and validated in an independent cohort of patients from HK (n=43) and Zurich (n=55). NTP, nearest-template prediction; qPCR, quantitative PCR. (B and C) Heat maps showing the expression profile of the 14 immune genes (log values) in (B) the training cohort and (C) the validation cohort. Patients are classified as good or poor prognosis according to prediction by the immune-gene signature. FDR, p value of the t test adjusted for false discovery rate (multiple testing). Kaplan–Meier analyses for survival in (D) the training cohort, based on leave-one-out cross-validation testing and in (E) the independent validation cohort. Good and poor prognosis refers to the outcome predicted by the immune signature. p, log rank test p value.
Figure 2
Figure 2
Superior prognostic power of the 14 immune-gene signature compared with clinical parameters. Kaplan–Meier analyses for survival of (A) stage I patients (n=55, training and validation cohort) according to the immune-gene signature accurately predicts patient survival; (B) stage I patients according to grade (n=50); (C) stage II patients (n=46, training and validation cohort) according to the immune gene signature accurately predicts patient survival and (D) stage II patients according to grade (n=45). p, log rank test p value. (E) The plot shows HRs with 95% CI for subgroups of patients according to clinical and demographic characteristics. Age, median=61; AFP conc (α-fetoprotein concentration), median=20 ng/ml; tumour size, median=4.3 cm.
Figure 3
Figure 3
CXCL10, CCL5 and CCL2 expression correlates with tumour infiltration by T and natural killer (NK) cells. (A) In patients with hepatocellular carcinoma (HCC; training and validation cohort, n=172), CXCL10, CCL5 and CCL2 RNA positively correlate with TBX21, CD8A and NCR3 (marked in red) but not with CD14, CD68, CD19, CD83, IL13, IL17, FOXP3 or IL10 (marked in blue). Graphs show p values against Pearson correlation coefficients r. The dotted line shows the limit of significance (p<0.05). (B) Representative immunofluorescence images showing higher density of CXCL10-expressing cells (red) in a tumour sample with high (left) versus low (right) density of infiltrating CD8+ and CD56+ cells as quantified by immunohistochemistry (IHC). The area in the rectangle is magnified in the left inset. Bar=50 μm; ×400 magnification. (C) Correlation of CXCL10 protein expression with the density of CD8+ (left) and CD56+ (right) immune cells. CXCL10 expression was determined by quantification of the CXCL10-labelled area, and CD8+ and CD56+ cell densities were measured by IHC in tumour fields of patient samples (CD8+, n=27; CD56+, n=19, training and validation cohort). p Values and correlation coefficients (r) were calculated using the Spearman correlation test. DAPI, 4′,6-diamidino-2-phenylindole.
Figure 4
Figure 4
CXCL10, CCL5 and CCL2 are produced by both immune and cancer cells within hepatocellular carcinoma (HCC) tumours. (A) Quantitative PCR (qPCR) analysis of CXCL10, CCL5 and CCL2 RNA expression in purified tumour cells (Tumour), tumour-infiltrating leucocytes (TIL) and unfractionated HCC nodules (HCC) from freshly resected tumours. The chemokines are expressed in all three compartments. Graphs show means and SD normalised to Tumour. (B) Representative immunohistochemistry images of CXCL10 (left) and CCL5 (right) showing expression in cells with cancer cell morphology. Bar=50 μm; ×200 magnification. (C) Representative immunofluorescence (IF) images showing co-localisation of CXCL10 (red) and CD68 (green). Bar=20 μm; ×800 magnification. (D) Representative IF images showing co-localisation of CCL5 (red) with either CD68 or CD3 (green). Bar=20 μm; ×800 magnification. DAPI, 4′,6-diamidino-2-phenylindole.
Figure 4
Figure 4
CXCL10, CCL5 and CCL2 are produced by both immune and cancer cells within hepatocellular carcinoma (HCC) tumours. (A) Quantitative PCR (qPCR) analysis of CXCL10, CCL5 and CCL2 RNA expression in purified tumour cells (Tumour), tumour-infiltrating leucocytes (TIL) and unfractionated HCC nodules (HCC) from freshly resected tumours. The chemokines are expressed in all three compartments. Graphs show means and SD normalised to Tumour. (B) Representative immunohistochemistry images of CXCL10 (left) and CCL5 (right) showing expression in cells with cancer cell morphology. Bar=50 μm; ×200 magnification. (C) Representative immunofluorescence (IF) images showing co-localisation of CXCL10 (red) and CD68 (green). Bar=20 μm; ×800 magnification. (D) Representative IF images showing co-localisation of CCL5 (red) with either CD68 or CD3 (green). Bar=20 μm; ×800 magnification. DAPI, 4′,6-diamidino-2-phenylindole.
Figure 5
Figure 5
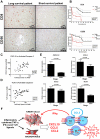
The production of CXCL10, CCL5 and CCL2 by HCC cell lines is induced by interferon γ (IFNγ), tumour necrosis factor α (TNFα) and Toll-like receptor 3 (TLR3) ligands. ELISA for (A) CXCL10, (B) CCL5 and (C) CCL2 concentration in culture supernatants from the SNU-182 hepatocellular carcinoma (HCC) cell line 24 h after stimulation with IFNγ, TNFα and/or poly(I:C). Two-tailed Student unpaired t test; *p<0.05; **p<0.01; ***p<0.001 compared with unstimulated control. Graphs show the means and SD from three independent experiments. (D) CXCL10, CCL5 and CCL2 RNA are positively correlated with IFNG, TNF and TLR3 in patients with HCC (training and validation cohort, n=172). Graphs show the p value against Pearson correlation coefficients r. Dotted lines show limits of significance for r (r=0.15) and p (p=0.05). (E) Transmigration assay with peripheral blood mononuclear cells (PBMCs) isolated from healthy donors (n=3) towards unstimulated or stimulated SNU-182 cells with IFNγ and poly(I:C) 24 h prior to transmigration. In blocking experiments, PBMCs were pretreated with anti-CXCR3 or anti-CCR5 neutralising antibodies at 37°C for 1.5 h. Graphs show means and SEM. p Values were calculated using paired t test against basal transmigration towards unstimulated HCC. *p<0.05. NK, natural killer.
Figure 6
Figure 6
High chemokine expression levels, hence tumour infiltration by T and natural killer (NK) cells, are associated with superior patient survival. (A) Representative immunohistochemistry (IHC) images of CD8 and CD56 labelling (in red) showing higher density of CD8+ T and CD56+ NK cells in tumours from patients with longer survival (median survival >3.9 years). Bar=50 μm; ×200 magnification. (B) Kaplan–Meier analysis showing that high density of intratumoural CD8+ and CD56+ immune cells is associated with superior patient survival. A subset of patients was chosen for immune cell quantification by IHC (CD8, n=46, median=74 cells per field; CD56, n=36, median= 42 cells per field; training and validation cohort). p, log rank p value. (C) CXCL10 (n=26) immunofluorescence and (D) Toll-like receptor 3 (TLR3) (n=39) IHC staining area positively correlated with the density of activated caspase-3-positive tumour cells. r, Spearman (CXCL10) or Pearson (TLR3) correlation coefficient. (E) Downregulation of CXCL10, CCL5, CCL2 and TLR3 RNA expression in stages II–IV (n=114) compared with stage I patients with hepatocellular carcinoma (HCC) (n=57). Graphs show means and SEM. p Values were calculated using two-tailed Mann–Whitney U test. *p<0.05; **p<0.01; ***p<0.001. (F) Model showing that the inflammatory cytokines tumour necrosis factor α (TNFα), interferon γ (IFNγ) and Toll receptor-like (TLR) ligands stimulate cancer cells or macrophages to produce the key chemokines CXCL10, CCL5 and CCL2. These chemokines induce tumour infiltration by T helper 1 (Th1), CD8+ T and NK cells which induce cancer cell killing and tumour control. Positive feedback loops result from the production of IFNγ by activated T or NK cells that further enhance CXCL10 production (red arrow) and CCL5 by activated T cells that can attract more T cells (blue arrow).

References

    1. El-Serag HB. Epidemiology of hepatocellular carcinoma in USA. Hepatol Res 2007;37(Suppl 2):S88–94 - PubMed
    1. Parkin DM, Bray F, Ferlay J, et al. Global cancer statistics, 2002. CA Cancer J Clin 2005;55:74–108 - PubMed
    1. Siegel AB, Olsen SK, Magun A, et al. Sorafenib: where do we go from here? Hepatology 2010;52:360–9 - PMC - PubMed
    1. Llovet JM, Burroughs A, Bruix J. Hepatocellular carcinoma. Lancet 2003;362:1907–17 - PubMed
    1. Hoshida Y, Nijman SM, Kobayashi M, et al. Integrative transcriptome analysis reveals common molecular subclasses of human hepatocellular carcinoma. Cancer Res 2009;69:7385–92 - PMC - PubMed

Publication types

MeSH terms