. 2011 Sep 26;208(10):1989-2003.
doi: 10.1084/jem.20101158. Epub 2011 Sep 19.

Type I interferon is selectively required by dendritic cells for immune rejection of tumors

Affiliations

Type I interferon is selectively required by dendritic cells for immune rejection of tumors

Mark S Diamond et al. J Exp Med. .

Abstract

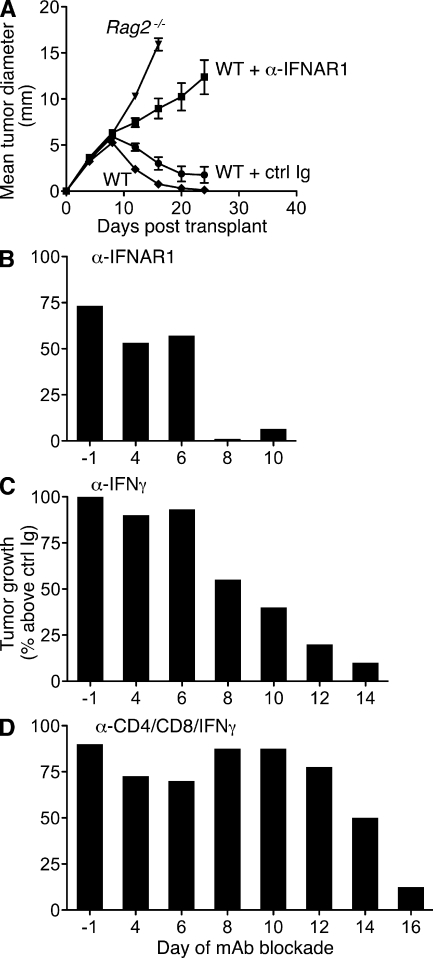
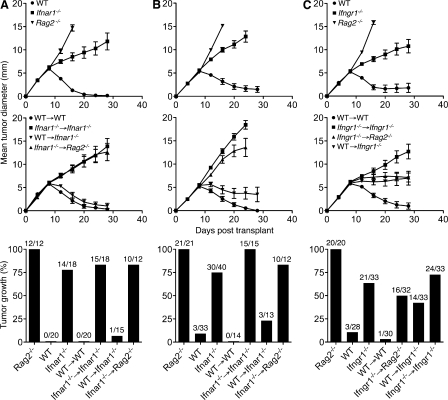
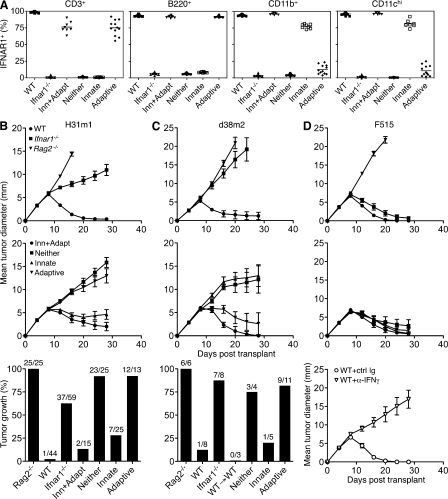
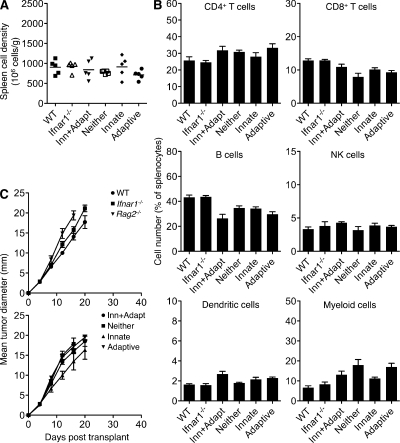
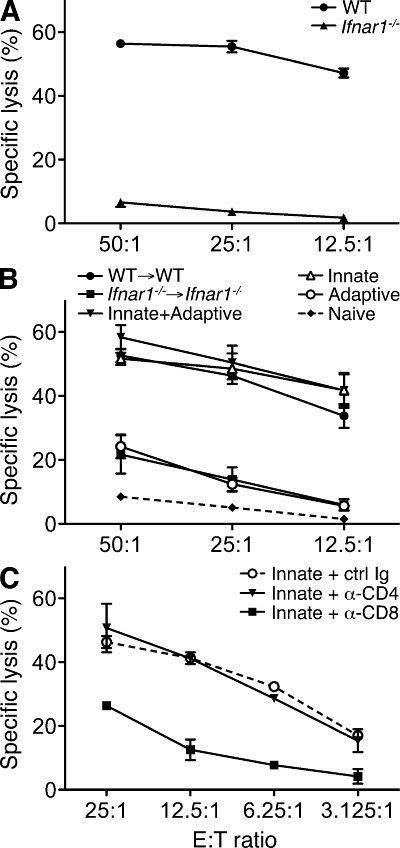
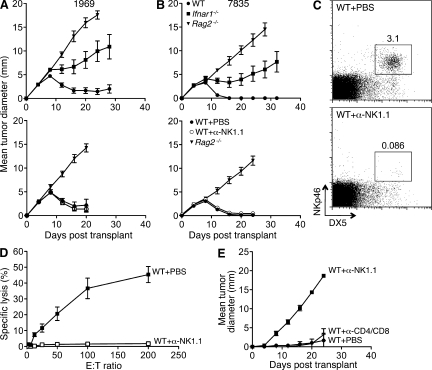
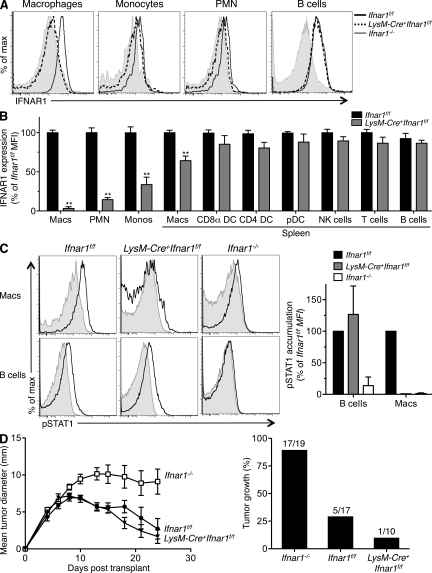
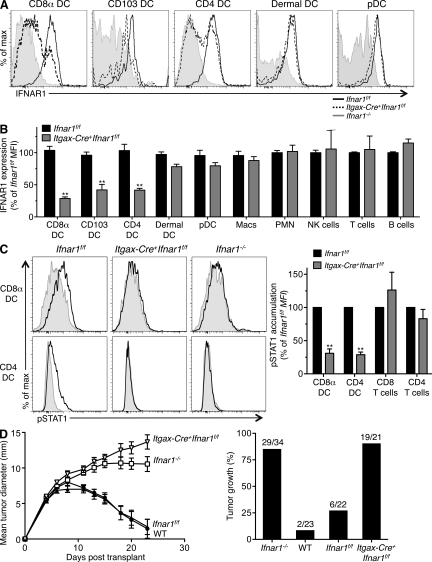
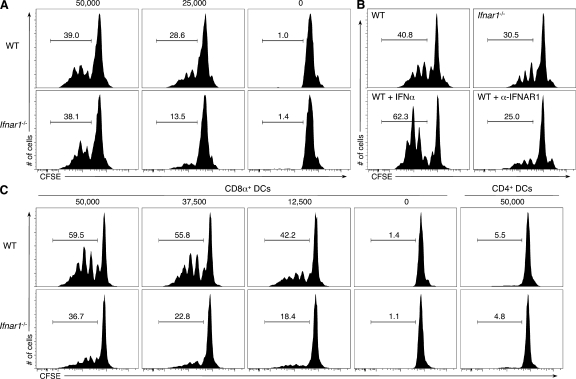
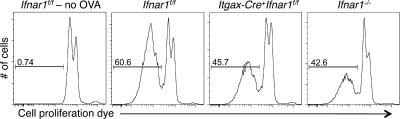
Cancer immunoediting is the process whereby the immune system suppresses neoplastic growth and shapes tumor immunogenicity. We previously reported that type I interferon (IFN-α/β) plays a central role in this process and that hematopoietic cells represent critical targets of type I IFN's actions. However, the specific cells affected by IFN-α/β and the functional processes that type I IFN induces remain undefined. Herein, we show that type I IFN is required to initiate the antitumor response and that its actions are temporally distinct from IFN-γ during cancer immunoediting. Using mixed bone marrow chimeric mice, we demonstrate that type I IFN sensitivity selectively within the innate immune compartment is essential for tumor-specific T cell priming and tumor elimination. We further show that mice lacking IFNAR1 (IFN-α/β receptor 1) in dendritic cells (DCs; Itgax-Cre(+)Ifnar1(f/f) mice) cannot reject highly immunogenic tumor cells and that CD8α(+) DCs from these mice display defects in antigen cross-presentation to CD8(+) T cells. In contrast, mice depleted of NK cells or mice that lack IFNAR1 in granulocytes and macrophage populations reject these tumors normally. Thus, DCs and specifically CD8α(+) DCs are functionally relevant targets of endogenous type I IFN during lymphocyte-mediated tumor rejection.


Figures

Figure 1.
Figure 1.
Early requirement for IFN-α/β during rejection of highly immunogenic tumor cells. (A) Untreated WT and Rag2−/− mice or WT mice injected i.p. with either IFNAR1-specific MAR1-5A3 mAb or isotype control GIR-208 mAb 1 d prior were s.c. injected with 106 H31m1 tumor cells, and tumor size was measured over time. Data represent mean tumor diameter ± SEM of 12–16 mice per group from at least three independent experiments. (B–D) WT mice were injected with 106 H31m1 cells (at day 0) and treated beginning on the indicated day with MAR1-5A3 (B), IFN-γ–specific H22 mAb (C), or a mixture of anti-CD4/anti-CD8/anti–IFN-γ mAbs GK1.5/YTS-169.4/H22 (D), and tumor growth was monitored. For each time point, groups of mice were treated in parallel with the respective isotype-matched control mAb, and the data are presented as percent tumor growth over the control group. Results are from two to four experiments with 14–20 (ctrl/MAR1-5A3), 10–20 (ctrl/H22), or 6–11 (ctrl/cocktail) WT mice per group. The kinetics of tumor growth in individual mice is shown in Fig. S1.
Figure 2.
Figure 2.
Nonoverlapping host cell targets for IFN-α/β and IFN-γ during tumor rejection. (A–C) Control mice and the indicated bone marrow chimeras with selective IFN-α/β sensitivity (A and B) or IFN-γ sensitivity (C) in hematopoietic versus nonhematopoietic cells were injected s.c. with 106 H31m1 (A) or d38m2 (B and C) unedited MCA sarcoma cells, and growth was monitored. Data are presented as mean tumor diameter ± SEM over time or the percentage of tumor-positive mice per group from two to three (A and B) or five (C) independent experiments with group sizes as indicated. Hematopoietic reconstitution of all Ifnar1−/− and Ifngr1−/− bone marrow chimeras was confirmed by flow cytometry at the conclusion of each experiment.
Figure 3.
Figure 3.
IFN-α/β sensitivity within the innate immune compartment is necessary and sufficient for tumor rejection. Mixed bone marrow chimeras with selective IFNAR1 expression in innate or adaptive immune cells were generated by reconstitution of irradiated Ifnar1−/− mice with mixtures of HSCs as described in Results. (A) Splenocytes were isolated from representative cohorts of control and mixed chimeric mice at least 12 wk after reconstitution, and IFNAR1 staining was analyzed by flow cytometry. Shown are the percentages of IFNAR1+ cells within the indicated immune cell subsets for 8–14 mice of each type. Horizontal bars represent the mean. (B–D) Control WT, Rag2−/−, and Ifnar1−/− mice and Ifnar1−/− mixed chimeric mice were injected with 106 H31m1 (B), d38m2 (C), or F515 (D) tumor cells, and growth was monitored over time. Data are presented as mean tumor diameter ± SEM or the percentage or tumor-positive mice per group from two to three independent experiments with group sizes as indicated. WT mice treated with control or IFN-γ–specific mAb were challenged with 106 F515 tumor cells, and growth was monitored (D, bottom). Mean tumor diameter ± SEM for 7–10 mice/group from two experiments is shown.
Figure 4.
Figure 4.
Normal hematopoietic reconstitution in Ifnar1−/− mixed bone marrow chimeras. (A) Spleens were harvested from WT, Ifnar1−/−, or Ifnar1−/− mixed chimeras of each type (12 wk after reconstitution), and cell density was determined. Horizontal bars represent the mean. (B) Percentages of the indicated immune cell subsets were measured by flow cytometry for WT, Ifnar1−/−, and Ifnar1−/− mixed chimeras. Mean values (as a percentage of total splenocytes) ± SEM for four to five mice/group are shown. Cell populations were defined as follows: CD4+ T cells (CD3+CD4+), CD8+ T cells (CD3+CD8+), B cells (B220+), NK cells (DX5+CD3), DCs (CD11chi), and myeloid cells (CD11b+). (C) WT-derived 1877 tumor cells were injected at a dose of 106 cells/mouse into WT, Ifnar1−/−, Rag2−/−, and Ifnar1−/− mixed chimeras, and tumor growth was monitored over time. Data represent the mean tumor diameter ± SEM for three to eight mice/group. (A–C) Data are representative of two independent experiments.
Figure 5.
Figure 5.
Impaired tumor-specific CTL priming in Ifnar1−/− mice is restored by IFN-α/β–responsive innate immune cells. (A) Splenocytes from WT and Ifnar1−/− mice were isolated 20 d after H31m1 tumor challenge (106 cells/mouse), co-cultured with IFN-γ–treated, irradiated H31m1 cells, and 5 d later used as effectors in a cytotoxicity assay with 51Cr-labeled H31m1 targets. Specific killing activity (in percentage ± SEM) at the indicated effector/target (E:T) ratios is shown for four to five mice per group assayed in duplicate from three independent experiments. (B) Splenocytes were harvested from the indicated chimeric mice 20 d after injection of 106 H31m1 tumor cells and were treated as in A. Data include representative results from three mice per group assayed in duplicate from two independent experiments. Splenocytes harvested from a naive mouse and treated similarly served as a negative control. (C) Effector cells from H31m1-challenged innate chimeras were co-cultured at the indicated effector/target ratios with 51Cr-labeled H31m1 targets in the presence of 10 µg/ml control (PIP), anti-CD4 (GK1.5), or anti-CD8 (YTS-169.4) mAbs. Data show representative results from three mice per group assayed in duplicate from three independent experiments. Similar results were obtained when effector cells from H31m1-injected WT mice were used (not depicted). (B and C) Error bars represent SEM.
Figure 6.
Figure 6.
NK cell depletion does not abrogate IFN-α/β–dependent rejection of immunogenic sarcomas. (A and B) C57BL/6 WT, Rag2−/−, and Ifnar1−/− mice and WT mice treated with either PBS or anti-NK1.1 PK136 mAb were injected s.c. (106 cells/mouse) with 1969 (A) or 7835 (B) unedited MCA sarcoma cells, and growth was monitored over time. Data are presented as mean tumor diameter ± SEM of 4–13 (untreated) or 8 (treated) mice per group from at least two independent experiments. Error bars for Ifnar1−/− mice reflect progressive growth of 1969 and 7835 tumors in 6/9 mice. (C) WT C57BL/6 mice were treated with either PBS or PK136 mAb, and splenocytes were harvested 2 d later and analyzed by flow cytometry using the NK cell markers DX5 and NKp46. Splenocytes were gated on CD3 cells, and the percentages of DX5+NKp46+ cells are indicated. Similar results were found when harvested at day 6 (not depicted). (D) WT C57BL/6 mice were treated with PBS or PK136 followed by i.p. injection of 300 µg polyI:C 4 d later. After 24 h, splenocytes were harvested and used as effectors in a standard 4-h cytotoxicity assay with NK-sensitive YAC-1 targets. Specific lysis (in percentage ± SEM) at the indicated effector/target (E:T) ratios is shown for four mice/group assayed in duplicate from two independent experiments. (E) WT C57BL/6 mice were treated with PBS, PK136, or a mixture of anti-CD4 (GK1.5) and anti-CD8 (YTS-169.4) mAbs and injected s.c. with 105 RMA-S cells, and tumor growth was monitored over time. Mean tumor diameter ± SEM for three mice/group is shown, and data are representative of two independent experiments.
Figure 7.
Figure 7.
Granulocytes and macrophages do not require type I IFN sensitivity for tumor rejection. (A) IFNAR1 expression on peritoneal macrophages, blood monocytes, PMNs, and B cells was measured using flow cytometry in Ifnar1f/f, LysM-Cre+Ifnar1f/f, and Ifnar1−/− mice. (B) Summary of IFNAR1 levels in the indicated cellular subsets in LysM-Cre+Ifnar1f/f mice compared with Ifnar1f/f mice (expressed as a percentage of the mean fluorescence intensity [MFI]). Cells were gated using the following markers: macrophages (CD11b+F4/80+), PMNs (CD11b+Gr1+), monocytes (CD115+CD11b+), B cells (B220+), CD8α+ DCs (CD8α+Dec205+CD11chi), CD4+ DCs (CD8αDec205CD11chiCD4+), pDCs (B220+PDCA+CD11cint), T cells (CD3+), and NK cells (NK1.1+). IFNAR1 expression was measured using MAR1-5A3 mAb. Data represent at least three mice from three independent experiments (**, P < 0.01). (C) Mature peritoneal macrophages from LysM-Cre+Ifnar1f/f mice were untreated (gray) or stimulated for 15 min with 10 ng/ml IFN-αv4 (black), and pSTAT1 accumulation was measured by flow cytometry. Histograms from a representative experiment are shown, with the bar graph summarizing pSTAT1 levels (as percentage of control Ifnar1f/f MFI) from two independent experiments. (B and C) Error bars represent SEM. (D) Ifnar1f/f, LysM-Cre+Ifnar1f/f, and Ifnar1−/− mice were injected s.c. with 106 1969 unedited sarcoma cells. Mean tumor diameter ± SEM from a representative experiment is shown, and the bar graph shows the percentage of tumor-positive mice per group from two independent experiments with indicated total group sizes.
Figure 8.
Figure 8.
DCs specifically require type I IFN sensitivity for tumor immunity in vivo. (A) IFNAR1 expression on splenic CD8α+ DCs, CD4+ DCs, pDCs, LN CD103+ DCs, and dermal DCs was measured using flow cytometry in Ifnar1f/f, Itgax-Cre+Ifnar1f/f, and Ifnar1−/− mice. (B) Summary of IFNAR1 levels on the indicated cellular subsets in Itgax-Cre+Ifnar1f/f mice compared with Ifnar1f/f mice (expressed as a percentage of control mean fluorescence intensity [MFI]). Cells were gated as follows: CD8α+ DCs (CD8α+Dec205+CD11chi), CD103 DCs (CD8αDec205+CD11chiCD103+), CD4+ DCs (CD8αDec205CD11chiCD4+), dermal DCs (CD8αCD11chiCD103), pDCs (B220+PDCA+CD11cint), B cells (B220+), T cells (CD3+), NK cells (NK1.1+), macrophages (CD11b+F4/80+), and blood PMNs (CD11b+Gr1+). IFNAR1 expression was measured using the MAR1-5A3 mAb. Data represent three to five mice from at least three independent experiments. (**, P < 0.01). (C) Splenocytes from Itgax-Cre+Ifnar1f/f mice were untreated (gray) or stimulated for 15 min with 10 ng/ml IFN-αv4 (black), and pSTAT1 accumulation in CD8α+ and CD4+ DCs was measured by flow cytometry. Histograms show a representative experiment, and the bar graph summarizes results from four independent experiments (**, P < 0.01). (B and C) Error bars represent SEM. (D) C57BL/6 WT, Ifnar1−/−, Ifnar1f/f, and Itgax-Cre+Ifnar1f/f mice were injected s.c. with 106 1969 unedited sarcoma cells. Mean tumor diameter ± SEM from a representative experiment is shown, and the bar graph shows a summary of the percentage of tumor-positive mice per group from three independent experiments with indicated groups sizes (P < 0.001 [WT vs. Ifnar1−/−] and P < 0.001 [Ifnar1f/f vs. Itgax-Cre+Ifnar1f/f]) using the Student’s t test at day 23. Comparisons of Ifnar1−/− versus Itgax-Cre+Ifnar1f/f or WT versus Ifnar1f/f were not significantly different.
Figure 9.
Figure 9.
Type I IFN sensitivity in CD8α+ DCs enhances antigen cross-presentation. (A) CD11c+ cells were isolated from the spleens of WT or Ifnar1−/− mice and co-cultured with the indicated number of irradiated, ovalbumin-loaded MHC class I−/− splenocytes and CFSE-labeled OT-I T cells. After a 3-d incubation, proliferation of OT-I T cells was determined by CSFE dilution. Histograms represent CFSE levels in the CD8+ T cell population, with the percentage of cells in the indicated gate noted. (B) WT and Ifnar1−/− CD11c+ cells or WT CD11c+ cells incubated with exogenous 1,000 U/ml IFN-α or 5 µg/ml IFNAR1-specific MAR1-5A3 mAb were treated as in A at a dose of 25,000 MHC class I−/− splenocytes. (C) Purified CD8α+ and CD4+ DC subsets isolated from WT or Ifnar1−/− mice were treated as in A with the indicated number of ovalbumin-loaded MHC class I−/− splenocytes. Data represent one of at least two independent experiments with similar results.
Figure 10.
Figure 10.
Impaired antigen cross-presentation in CD8α+ DCs from Itgax-Cre+Ifnar1f/f mice. CD8α+ DCs were isolated from Ifnar1f/f, Itgax-Cre+Ifnar1f/f, and Ifnar1−/− mice and incubated with OT-I T cells labeled with cell proliferation dye and 12,500 ovalbumin-loaded MHC class I−/− splenocytes. Dilution of the cell proliferation dye was measured 3 d later. Data represent one of at least two independent experiments with similar results.

Comment in

References

    1. Ackerman A.L., Cresswell P. 2004. Cellular mechanisms governing cross-presentation of exogenous antigens. Nat. Immunol. 5:678–684 10.1038/ni1082 - DOI - PubMed
    1. Belardelli F., Ferrantini M., Proietti E., Kirkwood J.M. 2002. Interferon-alpha in tumor immunity and immunotherapy. Cytokine Growth Factor Rev. 13:119–134 10.1016/S1359-6101(01)00022-3 - DOI - PubMed
    1. Biron C.A., Nguyen K.B., Pien G.C., Cousens L.P., Salazar-Mather T.P. 1999. Natural killer cells in antiviral defense: function and regulation by innate cytokines. Annu. Rev. Immunol. 17:189–220 10.1146/annurev.immunol.17.1.189 - DOI - PubMed
    1. Christensen J.L., Wright D.E., Wagers A.J., Weissman I.L. 2004. Circulation and chemotaxis of fetal hematopoietic stem cells. PLoS Biol. 2:E75 10.1371/journal.pbio.0020075 - DOI - PMC - PubMed
    1. Clausen B.E., Burkhardt C., Reith W., Renkawitz R., Förster I. 1999. Conditional gene targeting in macrophages and granulocytes using LysMcre mice. Transgenic Res. 8:265–277 10.1023/A:1008942828960 - DOI - PubMed

Publication types

MeSH terms