. 2011 Sep 19;194(6):825-39.
doi: 10.1083/jcb.201101148.

p63 regulates Satb1 to control tissue-specific chromatin remodeling during development of the epidermis

Affiliations

p63 regulates Satb1 to control tissue-specific chromatin remodeling during development of the epidermis

Michael Y Fessing et al. J Cell Biol. .

Abstract

During development, multipotent progenitor cells establish tissue-specific programs of gene expression. In this paper, we show that p63 transcription factor, a master regulator of epidermal morphogenesis, executes its function in part by directly regulating expression of the genome organizer Satb1 in progenitor cells. p63 binds to a proximal regulatory region of the Satb1 gene, and p63 ablation results in marked reduction in the Satb1 expression levels in the epidermis. Satb1(-/-) mice show impaired epidermal morphology. In Satb1-null epidermis, chromatin architecture of the epidermal differentiation complex locus containing genes associated with epidermal differentiation is altered primarily at its central domain, where Satb1 binding was confirmed by chromatin immunoprecipitation-on-chip analysis. Furthermore, genes within this domain fail to be properly activated upon terminal differentiation. Satb1 expression in p63(+/-) skin explants treated with p63 small interfering ribonucleic acid partially restored the epidermal phenotype of p63-deficient mice. These data provide a novel mechanism by which Satb1, a direct downstream target of p63, contributes in epidermal morphogenesis via establishing tissue-specific chromatin organization and gene expression in epidermal progenitor cells.


Figures
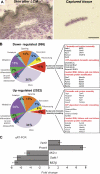
Figure 1.
Figure 1.
Changes in global transcription profile and expression of the genes encoding chromatin-remodeling factors in the epidermis of p63−/− mice. The skin of E16.5 p63−/− and WT mice was processed for LCM to isolate fragments of the epidermis. RNA was isolated from captured tissue, amplified, and processed for microarray and RT-PCR analyses. (A) Cryosection of the skin after LCM including a fragment of the captured epidermis. Bar, 25 µm. (B) Agilent microarray analysis of the laser-captured epidermis of p63−/− and WT mice. Diagrams showing the ontology of the down- and up-regulated genes in p63-null versus WT epidermis. Selected genes involved in the control of nuclear structure and chromatin remodeling, the expression of which was changed in the epidermis of p63−/− versus WT mice, are listed (a full list of the genes is shown in Tables S1 and S2). (C) Real-time PCR for Satb1, Mi-2α, Mi-2β, Terf2, and Prmt4 in the E16.5 epidermis of p63−/− mice normalized to the corresponding levels in age-matched WT mice. Error bars represent SEM.
Figure 2.
Figure 2.
p63 controls the expression of Satb1 in epidermal progenitor cells. The skin of p63-deficient and WT embryos was processed for immunofluorescent analyses as well as for modulation of gene expression in organ culture experiments with p63 siRNA. (A) Double immunofluorescence showing coexpression of p63 and Satb1 in the nuclei of basal epidermal cells in E16.5 WT mice. (B and C) Immunostaining for Satb1 (B) and K18 (C) in the E16.5 skin of WT and p63−/− mice. Marked decrease of Satb1 expression in the epidermis (EP) of p63−/− mice is magnified in the dashed boxes. (D) Immunostaining for p63, Satb1, and Loricrin in the E13.5 skin samples of heterozygous p63 knockout (+/−) mice cultured in the presence of p63 siRNA or control siRNA for 48 h. In epidermis, the expression of p63, Satb1, and Loricrin proteins in the p63 siRNA–treated samples was decreased compared with the controls. (B and D) The epidermal–dermal junction is shown by dotted lines. Bars, 25 µm.
Figure 3.
Figure 3.
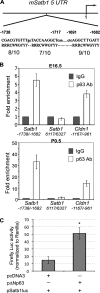
Satb1 is a direct target of p63 in keratinocytes. Primary keratinocytes isolated from E16.5 embryos or newborn mice were processed for ChIP analysis with an antibody against the p63 protein or purified rabbit IgGs. HaCaT cells were used in cotransfection experiments with Satb1 promoter–driven reporter construct. (A and B) Quantitative RT-PCR analysis of two distinct regions of the Satb1 (a predicted high-affinity p63-binding site and a negative control site) showing a specific high-affinity p63-binding site at the Satb1 promoter. In A, the position 1 refers to 5′ of Satb1 transcript (AK037740). The uppercase letters of the sequence show the p63 putative binding sites in the promoter region of the Satb1 gene chosen for the quantitative PCR analysis after ChIP. The promoter region of the Cldn1 was used as a positive control. The input levels of unprecipitated chromatin DNA were used as loading controls. Error bars represent SEM, and three independent experiments were run in triplicate. (C) HaCaT keratinocytes were cotransfected with the luciferase reporter plasmid containing a mouse Satb1 promoter fragment and pΔNp63 expression plasmid or control pcDNA3 plasmid. The increase in the pSatb1-luc activities by cotransfection with pΔNp63 compared with the control pcDNA3 was ∼3.3 fold (mean ± SEM, n = 3; *, P < 0.05, Student’s t test).
Figure 4.
Figure 4.
Alterations in the conformation of the 5 Mb chromatin domain containing EDC in the epidermis of p63−/− and Satb1−/− mice. The skin of E16.5 p63−/−, Satb1−/−, and corresponding WT mice was processed for 3D FISH analyses, which were correlated with changes in gene expression determined by quantitative RT-PCR. (A) A schematic structure of the 5 Mb domain on mouse chromosome 3 (mChr3) containing the EDC locus, Rps27, and Gabpb2 genes. 3D FISH DNA probes detecting the corresponding domains are shown in green (Loricrin), pink (Rps27), and yellow (Gabpb2). Genes selected for quantitative RT-PCR analysis (shown in E) are shown in red. LEP, late-cornified envelope protein. (B) Multicolor 3D FISH with BACs covering the Rps27, Lor, and Gabpb2 in the epidermal cells of p63−/−, Satb1−/−, and corresponding WT mice at E16.5 (representative single Z sections). Bar, 2 µm. (C) 3D FISH distances between the Rps27and Lor normalized to the radius of each nuclei in basal epidermal cells of p63−/−, Satb1−/−, and corresponding WT mice. Pairwise comparisons represent a significant increase in the Lor-Rps27 distances between the E16.5 WT versus p63−/− or Satb1−/− mice (mean ± SEM, n = 60; *, P < 0.01, Newman–Keuls test after a one-way ANOVA test). (D) 3D FISH distances between the Rps27and Lor and the Lor and Gabpb2 in basal epidermal cells and dermal cells of p63−/−, Satb1−/−, and corresponding WT mice. Pairwise comparisons represent a significant increase in the Lor-Rps27 distances between the E16.5 WT versus p63−/− or Satb1−/− mice (mean ± SEM, n = 60; P < 0.01, Newman–Keuls test after a one-way ANOVA test). (E) Quantitative RT-PCR analyses of gene expression in the 5 Mb domain containing EDC in the epidermis of E16.5 p63−/− and Satb1−/− mice normalized to the expression levels in the corresponding WT mice. White slashes represent the interruption of these bars to indicate that they show the fold changes in gene expression levels higher than the maximum value in the y axis. The exact fold changes are indicated under each bar. SEM is shown in the appropriate scale (relative to the y axis). Three independent experiments were run in triplicate.
Figure 5.
Figure 5.
Satb1 knockout mice show alterations in the epidermal structure and Loricrin expression. Cryosections of the footpad skin of newborn Satb1−/− and WT mice were processed for morphometric and immunofluorescent analyses. (A) Alterations in the structure and thinning of granular layer (arrows) in the epidermis of Satb1−/− mice compared with WT mice. Bars, 25 µm. (B) Significant (*, P < 0.05) decrease of the epidermal thickness in the epidermis of Satb1−/− mice compared with WT mice. Measurements of the epidermal thickness were performed in three Satb1−/− and three WT mice. 20 measurements were performed in each mouse. (C) Significant (*, P < 0.05) decrease of cell proliferation in the epidermis of Satb1−/− mice versus WT controls. The percentages of the Ki-67+ nuclei were determined in the epidermis of two Satb1−/− and two WT mice; 40–50 nuclei were analyzed in each animal. (B and C) Error bars represent SEM. (D) Decrease of Loricrin expression in the epidermis of Satb1−/− versus WT mice. Bars, 25 µm. (E) Agilent microarray data demonstrating changes in gene expression in the EDC between P0.5 Satb1−/− and WT mice. Asterisks indicate the fold changes in gene expression levels validated by quantitative RT-PCR.
Figure 6.
Figure 6.
Treatment with Satb1-expressing lentivirus partially rescues alterations of epidermal phenotype in skin explants caused by p63 deficiency. The skin of p63+/− and WT E13.5 embryos was processed for modulation of gene expression in organ culture with p63 siRNA and Satb1-expressing lentivirus. (A and B) Morphology of E13.5 skin explants of p63+/− mice treated with combinations of p63 or control siRNAs and Satb1-expressing or control lentiviruses (LV) for 48 h. The decrease of the epidermal thickness induced by p63 siRNA is significantly (**, P < 0.01) rescued by the cotreatment with Satb1-expressing lentivirus compared with corresponding controls. Epidermal thickness was measured in three samples for each experimental group; 60 measurements were conducted in each sample. (C and D) Cotreatment with Satb1-expressing lentivirus prevents the decrease of cell proliferation in the epidermis of skin explants induced by p63 siRNA compared with controls (*, P < 0.05). The percentages of Ki-67+ cells were analyzed in three samples for each experimental group; 30 cells were analyzed in each sample. (A and D) The dotted lines show the position of the basement membrane separating the epidermis and dermis. (E and F) Quantitative RT-PCR for Loricrin and Satb1 (E) and immunostaining for Loricrin (F). Levels of Loricrin transcripts and the expression of protein decreased after p63 siRNA treatment restored in the epidermis after cotreatment with Satb1-expressing lentivirus compared with the controls (F, arrows). Treatment with Satb1-expressing lentivirus resulted in a marked increase of Satb1 transcript levels in the epidermis after decrease induced by p63 siRNA (E). (A, D, and F) The epidermal–dermal junction is shown by dotted lines. (B, C, and E) Error bars represent SEM. Bars: (A and F) 50 µm; (D) 25 µm.
Figure 7.
Figure 7.
Satb1 binds the central EDC domain and regulates its conformation in epidermal cells. Primary mouse keratinocytes were processed for ChIP-on-chip analyses with Satb1 antibody, and skin cryosections of E16.5 and P0.5 Satb1−/− and WT mice were processed for 3D FISH analyses of the EDC chromatin structure. (A) ChIP-on-chip analysis of the Satb1 binding to the distinct genomic regions of the 5 Mb chromatin domain on mouse chromosome 3 (chr3) containing EDC in primary keratinocytes. Enrichment of the Satb1-binding sites at the distinct EDC regions including the central domain. Lack of Satb1 binding to the gene desert region between the 5′ end and the central domain of the locus. LEP, late-cornified envelope protein. (B) 3D FISH analyses of the volume of central EDC domain as well as the EDC length with probes detecting the 5′ and 3′ ends of the EDC (S100a6 and S100a10 genes, respectively) and the central domain (Lor-Lce3c) in the basal epidermal cells of Satb1−/− and WT mice. Representative single Z optical sections of newborn WT and Satb1 knockout keratinocyte nuclei are shown. Consecutive Z sections of the same nuclei are shown in Fig. S5 E. Arrows indicate the FISH signals. Bar, 2 µm. (C) The volume of the EDC central domain and the length of the total EDC locus were measured and compared between nuclei of basal epidermal cells of Satb1−/− and WT mice. The distribution of the data after measuring the total EDC length with or without normalization to the corresponding nuclear radii (left and middle, respectively) and the volume of the central domain (right) in 60–70 loci of basal epidermal cells at P0.5 Satb1−/− and WT mice is shown. Individual loci are shown in the x axis. (D) Statistical analysis shows a significant increase of the volume of central EDC domain in Satb1−/− mice compared with that of WT mice. The length of the total EDC increases in P0.5 Satb1−/− mice compared with WT mice.

References

    1. Agrelo R., Souabni A., Novatchkova M., Haslinger C., Leeb M., Komnenovic V., Kishimoto H., Gresh L., Kohwi-Shigematsu T., Kenner L., Wutz A. 2009. SATB1 defines the developmental context for gene silencing by Xist in lymphoma and embryonic cells. Dev. Cell. 16:507–516 10.1016/j.devcel.2009.03.006 - DOI - PMC - PubMed
    1. Alvarez J.D., Yasui D.H., Niida H., Joh T., Loh D.Y., Kohwi-Shigematsu T. 2000. The MAR-binding protein SATB1 orchestrates temporal and spatial expression of multiple genes during T-cell development. Genes Dev. 14:521–535 - PMC - PubMed
    1. Antonini D., Rossi B., Han R., Minichiello A., Di Palma T., Corrado M., Banfi S., Zannini M., Brissette J.L., Missero C. 2006. An autoregulatory loop directs the tissue-specific expression of p63 through a long-range evolutionarily conserved enhancer. Mol. Cell. Biol. 26:3308–3318 10.1128/MCB.26.8.3308-3318.2006 - DOI - PMC - PubMed
    1. Bazzi H., Fantauzzo K.A., Richardson G.D., Jahoda C.A., Christiano A.M. 2007. Transcriptional profiling of developing mouse epidermis reveals novel patterns of coordinated gene expression. Dev. Dyn. 236:961–970 10.1002/dvdy.21099 - DOI - PubMed
    1. Blanpain C., Fuchs E. 2009. Epidermal homeostasis: a balancing act of stem cells in the skin. Nat. Rev. Mol. Cell Biol. 10:207–217 10.1038/nrm2636 - DOI - PMC - PubMed

Publication types

MeSH terms