. 2011 Sep 19;194(6):905-20.
doi: 10.1083/jcb.201104114.

GRK5 promotes F-actin bundling and targets bundles to membrane structures to control neuronal morphogenesis

Affiliations

GRK5 promotes F-actin bundling and targets bundles to membrane structures to control neuronal morphogenesis

Yuejun Chen et al. J Cell Biol. .

Abstract

Neuronal morphogenesis requires extensive membrane remodeling and cytoskeleton dynamics. In this paper, we show that GRK5, a G protein-coupled receptor kinase, is critically involved in neurite outgrowth, dendrite branching, and spine morphogenesis through promotion of filopodial protrusion. Interestingly, GRK5 is not acting as a kinase but rather provides a key link between the plasma membrane and the actin cytoskeleton. GRK5 promoted filamentous actin (F-actin) bundling at the membranes of dynamic neuronal structures by interacting with both F-actin and phosphatidylinositol-4,5-bisphosphate. Moreover, separate domains of GRK5 mediated the coupling of actin cytoskeleton dynamics and membrane remodeling and were required for its effects on neuronal morphogenesis. Accordingly, GRK5 knockout mice exhibited immature spine morphology and deficient learning and memory. Our findings identify GRK5 as a critical mediator of dendritic development and suggest that coordinated actin cytoskeleton and membrane remodeling mediated by bifunctional actin-bundling and membrane-targeting molecules, such as GRK5, is crucial for proper neuronal morphogenesis and the establishment of functional neuronal circuitry.


Figures

Figure 1.
Figure 1.
GRK5 regulates dendritic development. (A and B) Hippocampal neuron cultures transfected at DIV5 were observed at DIV8. Total dendritic branch tip numbers (TDBTN) and total dendrite length of transfected neurons were measured. For each group, 40–60 (A) or 30–40 (B) neurons from three independent cultures were analyzed. One-way ANOVA followed by Tukey–Kramer posthoc test. (C and D) Hippocampal neurons were transfected at DIV9 and observed at DIV17. Boxed regions are enlarged below each image. For each group, 30–40 dendrites of 8–10 neurons from three independent cultures were analyzed. Protrusion and spine number were measured. (C) GFP was cotransfected with GRK5 variants to visualize dendritic spines (one-way ANOVA followed by Tukey–Kramer posthoc test). (D) Neuron cultures transfected with control or GRK5 RNAi constructs (Student’s t test). Bars, 10 µm. Error bars indicate SEM. *, P < 0.03; **, P < 0.01; ***, P < 0.001. Ctrl, control.
Figure 2.
Figure 2.
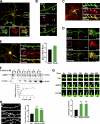
GRK5 interacts with F-actin and promotes filopodia formation and dynamics. (A–E) Colocalization of GRK5 with F-actin at sites of actin high dynamic structures. (A–C) Neurons were transfected with HA-tagged GRK5 and stained with HA antibody and Alexa Fluor 546 phalloidin. (A and B) Neurons transfected after dissection and stained at DIV2. (C) Neurons transfected at DIV9 and stained at DIV17. (B and C) Arrowheads indicate the colocalization of GRK5 with F-actin. (D and E) Neurons were stained at DIV1 (D) or at DIV14 (E) with GRK5 antibody (G-2) and Alexa Fluor 546 phalloidin. Arrowheads indicate the colocalization of GRK5 with F-actin in filopodia of growth cone (D) and dendritic spines (E). (E) The ratio of fluorescent intensity for GRK5 and F-actin in spines versus shafts was plotted. (F) High-speed sedimentation F-actin–binding assays. 1 µM purified GRK5 was incubated with F-actin for 30 min. Samples were centrifuged at 350,000 g for 30 min, and the supernatant (S) and the resuspended pellet (P) were analyzed by SDS-PAGE and Coomassie blue staining. The percentages of GRK5 bound to F-actin were calculated as the percentage recovered in the pellet subtracted by that recovered in the pellet without F-actin of five independent experiments. (G) GRK5 promotes the dynamics of filopodia. Time-lapse series of a neuron 2 d after transfection with the indicated constructs. Images shown are high-magnification images of a filopodial elongating from the shaft of the dendrite. The filopodial elongation/withdrawal velocities were measured. **, P < 0.003 (one-way ANOVA followed by Tukey–Kramer posthoc test). (H) GRK5 promotes the formation of filopodia-like protrusions. Shown are selected neuritic regions from DIV2 neurons transfected with the indicated constructs. GFP was cotransfected with GRK5 variants to visualize dendrite and filopodia. Protrusion densities were measured. **, P < 0.01 (one-way ANOVA followed by Tukey–Kramer posthoc test). Error bars indicate SEM. Boxed regions in images indicate enlarged areas. Ctrl, control. Bars: (A and B) 5 µm; (C–E and H) 10 µm; (G) 1 µm.
Figure 3.
Figure 3.
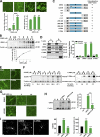
GRK5 rearranges F-actin into bundles, and this requires its C-terminal basic residues essential for F-actin binding. (A, E, and G) Visualization of F-actin bundles by confocal microscopy. Alexa Fluor 488–labeled G-actin was polymerized in the presence of the indicated concentration of purified GRK5 (A), 1 µM BSA or purified GRK5 variants, or 2 µM GRK5 variants in the presence or absence of indicated concentrations of Ca2+/calmodulin. The number of F-actin bundles in five randomly selected images from three independent experiments was analyzed. The thickest region of F-actin bundles was calculated as the width of F-actin bundles. 16–49 F-actin bundle filaments from each were analyzed. One-way ANOVA followed by Tukey–Kramer posthoc test. Bars, 5 µm. (B, F, and H) Low-speed sedimentation F-actin–bundling assay. Polymerized G-actin was incubated in the presence of an increasing concentration of purified GRK5 or 2 µM GRK5 variants in the presence or absence of 10 µM Ca2+/calmodulin. After centrifugation at 10,000 g, the pellet (P) and the supernatant (S) were analyzed by SDS-PAGE and Coomassie blue staining. The percentage of F-actin present in the bundles was calculated as the percentage recovered in the pellet subtracted by that recovered in the pellet without GRK5. One-way ANOVA followed by Tukey–Kramer posthoc test. (C) Schematic presentation of GRK5 constructs and their colocalization with F-actin. N, M, and C refer to the N-terminal, middle, and C-terminal domains. White boxes refer to the regions containing the polybasic amino acid sequences in the N and C termini. Orange in white boxes indicates polybasic amino acid sequences with alanine substitutions (K22A, R23A, K24A, K26A, K28A, and K29A in N terminus and K547A, K548A, R553A, K556A, and R557A in C terminus). (D) High-speed sedimentation F-actin–binding assay. The percentages of proteins bound to F-actin were calculated as the percentage recovered in the pellet of three independent experiments. Student’s t test. (I) Hippocampal primary neuron cultures were transfected with GFP or GFP with GRK5 or C-PBA at DIV5 and were observed at DIV8. Values of 40–60 neurons from three independent cultures were analyzed. One-way ANOVA followed by Tukey–Kramer posthoc test. Bar, 10 µm. Error bars indicate SEM. **, P < 0.01; ***, P < 0.001. Ctrl, control.
Figure 4.
Figure 4.
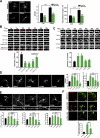
The effects of GRK5 on filopodial dynamics and dendritic development depend on its PI(4,5)P2-binding capability. (A) Hippocampal neuron cultures transfected with GFP or GFP and GRK5 at DIV5 were treated at DIV8 with 1 µm PAO and 100 nM BK (BK+PAO) for 8 h. Values of 20–30 neurons from three independent cultures were analyzed. One-way ANOVA followed by Tukey–Kramer posthoc test. (B and C) Time-lapse series of filopodial dynamics of hippocampal primary neurons at DIV2. Images were taken every 10 s, and filopodial elongation/withdrawal rates were measured. (B) Neurons transfected with GRK5-GFP were treated with 10 µM ionomycin or pretreated with 1 µM PAO for 5 min and then stimulated with 1 µM BK. Neurons coexpressing GRK5-GFP, Lyn11-FRB (Lyn), and CFP-FKBP-Inp54p (InP) or CFP-FKBP-Inp54p (D281A) were also observed after treatment with 100 nM rapamycin. (C) Neurons cotransfected with GFP after dissection and the indicated constructs were observed at DIV2. One-way ANOVA followed by Tukey–Kramer posthoc test. Red arrowheads indicate dynamic filopodia. (D and E) Hippocampal neuron cultures were transfected at DIV5 and observed at DIV8 (D) or transfected at DIV9 and observed at DIV17 (E). GFP was cotransfected with GRK5 variants to visualize dendritic spines. Values of 30–40 neurons from three independent cultures were analyzed. One-way ANOVA followed by Tukey–Kramer posthoc test. Boxed regions are enlarged below each image. (F) 0.5 µM Alexa Fluor 488–labeled polymerized F-actin was incubated with 10 µM phosphatidylcholine (PC)- or PI(4,5)P2 (PIP2)-containing liposomes in the presence of 2 µM GRK5 or N-PBA for 1 h and imaged by confocal microscopy. Arrowheads indicate the liposomes that associate with and distribute along the actin bundles. Values from six to eight randomly selected images were analyzed. Student’s t test. Error bars indicate SEM. *, P < 0.05; **, P < 0.01; ***, P < 0.001. Ctrl, control. Bars: (A, D, and E) 10 µm; (B and C) 1 µm; (F) 5 µm.
Figure 5.
Figure 5.
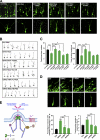
GRK5 regulates dendritic development in vivo. (A–C) Mouse embryos were electroporated in utero at E15.5 with the indicated plasmids, and brain sections were prepared on P7 and stained with GFP antibody to visualize transfected neurons. (A) Confocal images of GFP-positive neurons in layer II/III of the somatosensory cortex. Higher magnification images are shown below. (B) Reconstructions of cortical neurons using Neurolucida. (C) Total dendritic branch number and length of cortical neurons of 70–100 neurons from ≤5 to 10 brains. One-way ANOVA followed by Tukey–Kramer posthoc test. (D) Embryos were electroporated in utero at E15.5 with indicated plasmids, and brain sections were prepared on E17.5 and stained with GFP antibody for visualization of transfected neurons. Shown are images of GFP-positive neurons in the intermediate zone. Arrowheads indicate neurons with at least three processes. Data plotted are percentages of neurons with at least three processes and total branch number quantified from 180–400 neurons from three brains. IZ, intermediate zone. One-way ANOVA followed by Tukey–Kramer posthoc test. (E) Cartoon for the proposed model of GRK5-regulated neuronal morphogenesis. GRK5 forms dimers or oligomers to cross-link F-actin into bundles through its C-terminal F-actin binding domain and target the bundled actin to a PI(4,5)P2 (PIP2)-rich membrane through its N-terminal PI(4,5)P2 binding domain. This facilitates filopodial protrusion, neurite initiation and branching, and spine morphogenesis. This process could be regulated by Ca2+/calmodulin through its direct competition with F-actin for binding to GRK5 and by Gαq-coupled receptors through PLC-stimulated PI(4,5)P2 turnover. Error bars represent means ± SEM. *, P < 0.05; **, P < 0.01; ***, P < 0.001. Ctrl, control. Bars, 10 µm.
Figure 6.
Figure 6.
GRK5 KO mice exhibit immature spine morphology and impaired learning and memory. (A–C) Morphological analysis of hippocampal neurons. (A) Confocal images of dendritic spines of pyramidal neuron in Golgi-stained hippocampal slices. Arrows indicate typical dendritic spines. (B and C) Quantification of number and head/neck ratios of spines randomly selected from the apical dendrites (n = 200–250) of hippocampal pyramidal neurons from adult WT (n = 3) and GRK5 KO (n = 4) mice. **, P < 0.01; ***, P < 0.001 versus WT (Student’s t test). Bar, 2 µm. (D and E) Morris water maze test. (D) The escape latency for hidden platform during the consecutive 7-d training (F (1,38) = 26.66; P < 0.001, two-way ANOVA). (E) Searching time in left, target, right, and opposite quadrants during the probe test conducted on day 8. WT, n = 18; GRK5 KO, n = 22. *, P < 0.05 versus WT (Student’s t test). (F) Novel object location preference task. GRK5 KO mice (n = 17) and WT mice (n = 15) were subjected to a 1 h-delay object location test. The percentage of time spent exploring the object that has been moved to a novel location was calculated. GRK5 KO mice showed impaired novel location preference. **, P < 0.01 as compared with the chance level (50%); *, P < 0.05, compared with WT (Student’s t test). (G) Object recognition test. Mice were tested 1 or 24 h after training. The percentage of time spent exploring the novel object was calculated. The red dotted line indicates a 50% chance level. WT, n = 15; GRK5 KO, n = 17. **, P < 0.01 versus the chance level (50%; Student’s t test). Error bars indicate SEM.

References

    1. Ahmari S.E., Smith S.J. 2002. Knowing a nascent synapse when you see it. Neuron. 34:333–336 10.1016/S0896-6273(02)00685-2 - DOI - PubMed
    1. Burnette D.T., Schaefer A.W., Ji L., Danuser G., Forscher P. 2007. Filopodial actin bundles are not necessary for microtubule advance into the peripheral domain of Aplysia neuronal growth cones. Nat. Cell Biol. 9:1360–1369 10.1038/ncb1655 - DOI - PubMed
    1. Carlson B., Soderling S.H. 2009. Mechanisms of cellular protrusions branch out. Dev. Cell. 17:307–309 10.1016/j.devcel.2009.08.015 - DOI - PMC - PubMed
    1. Carman C.V., Parent J.L., Day P.W., Pronin A.N., Sternweis P.M., Wedegaertner P.B., Gilman A.G., Benovic J.L., Kozasa T. 1999. Selective regulation of Galpha(q/11) by an RGS domain in the G protein-coupled receptor kinase, GRK2. J. Biol. Chem. 274:34483–34492 10.1074/jbc.274.48.34483 - DOI - PubMed
    1. Catapano L.A., Manji H.K. 2007. G protein-coupled receptors in major psychiatric disorders. Biochim. Biophys. Acta. 1768:976–993 10.1016/j.bbamem.2006.09.025 - DOI - PMC - PubMed

Publication types