. 2011 Dec;31(23):4814-31.
doi: 10.1128/MCB.05819-11. Epub 2011 Sep 19.

Functional elements in initiation factors 1, 1A, and 2β discriminate against poor AUG context and non-AUG start codons

Affiliations

Functional elements in initiation factors 1, 1A, and 2β discriminate against poor AUG context and non-AUG start codons

Pilar Martin-Marcos et al. Mol Cell Biol. 2011 Dec.

Abstract

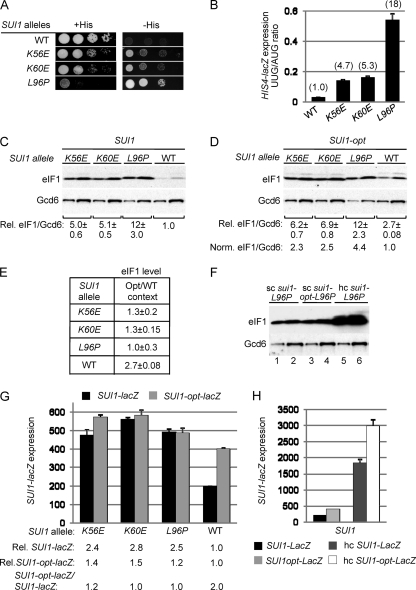
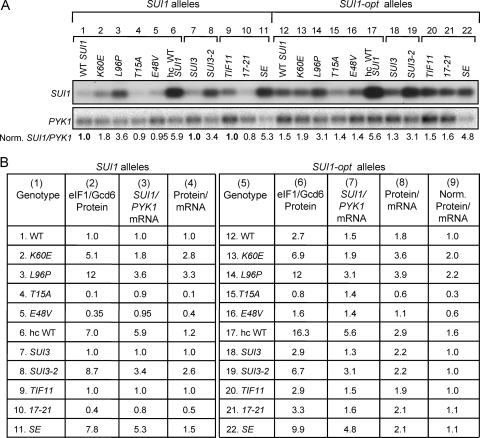
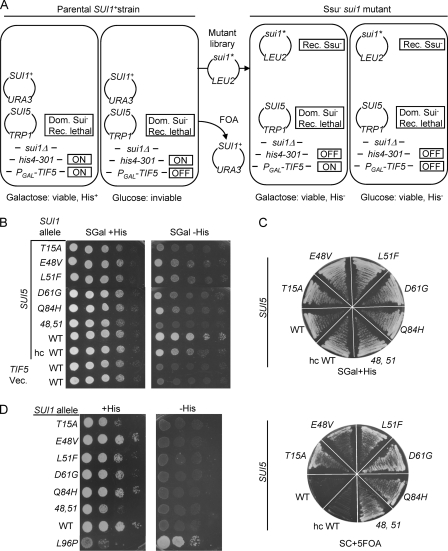
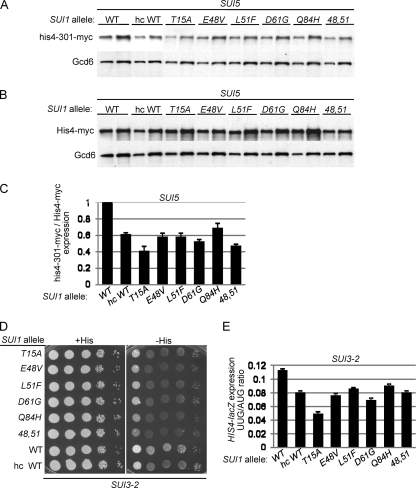
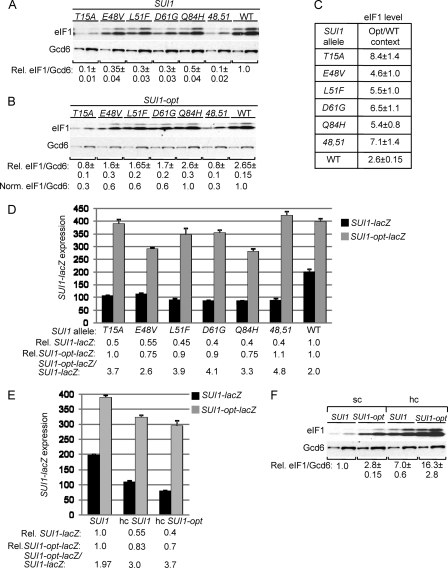
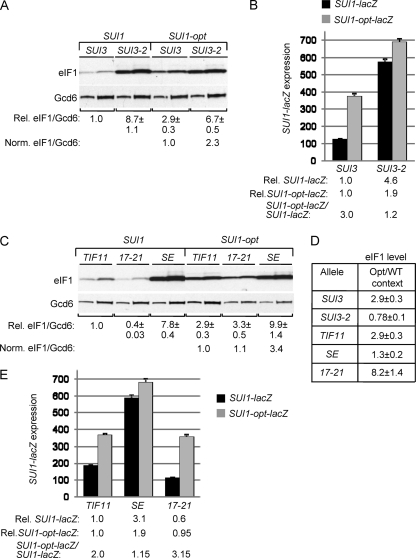
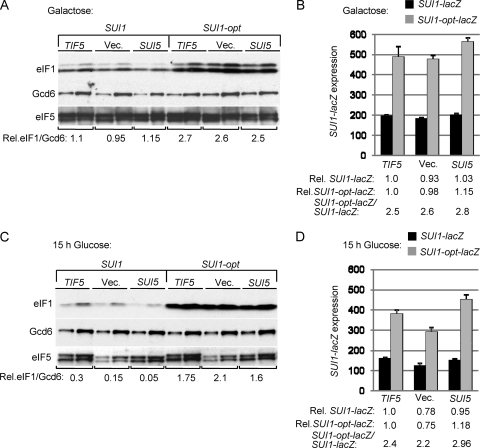
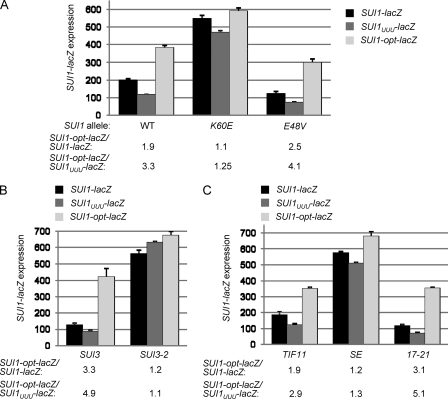
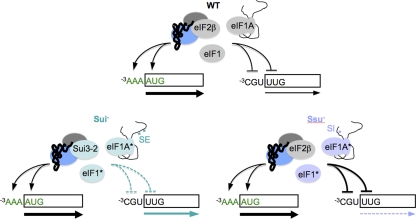
Yeast eIF1 inhibits initiation at non-AUG triplets, but it was unknown whether it also discriminates against AUGs in suboptimal context. As in other eukaryotes, the yeast gene encoding eIF1 (SUI1) contains an AUG in poor context, which could underlie translational autoregulation. Previously, eIF1 mutations were identified that increase initiation at UUG codons (Sui(-) phenotype), and we obtained mutations with the opposite phenotype of suppressing UUG initiation (Ssu(-) phenotype). Remarkably, Sui(-) mutations in eukaryotic translation initiation factor 1 (eIF1), eIF1A, and eIF2β all increase SUI1 expression in a manner diminished by introducing the optimal context at the SUI1 AUG, whereas Ssu(-) mutations in eIF1 and eIF1A decrease SUI1 expression with the native, but not optimal, context present. Therefore, discrimination against weak context depends on specific residues in eIFs 1, 1A, and 2β that also impede selection of non-AUGs, suggesting that context nucleotides and AUG act coordinately to stabilize the preinitiation complex. Although eIF1 autoregulates by discriminating against poor context in yeast and mammals, this mechanism does not prevent eIF1 overproduction in yeast, accounting for the hyperaccuracy phenotype afforded by SUI1 overexpression.


Figures

Fig. 1.
Fig. 1.
SUI1 Sui mutations increase SUI1 expression by suppressing poor AUG context. (A) Slg and His+/Sui phenotypes of derivatives of sui1Δ his4-301 strain JCY03 containing the indicated SUI1 alleles on sc plasmids determined by spotting serial 10-fold dilutions on synthetic complete medium lacking leucine (Leu) supplemented with 0.3 mM histidine (+His) or 0.003 mM His (−His) and incubating for 3 days (+His) or 7 days (−His) at 30°C. (B) Strains from panel A also harboring HIS4-lacZ reporter plasmids with an AUG (p367) or UUG (p391) start codon were cultured in synthetic dextrose minimal medium (SD) supplemented with His and tryptophan (Trp) at 30°C to an A600 of ∼1.0, and β-galactosidase activities (nmol of o-nitrophenyl β-d-galactopyranoside cleaved per min per mg) were measured in WCEs. The ratio of expression of the UUG versus AUG reporter was calculated for replicate experiments, and the means and standard errors of the mean (SEM [error bar]) were plotted. Numbers in parentheses are the means normalized to the WT value. (C to E) SUI1 Sui mutations elevate eIF1 expression dependent on the SUI1 AUG context. Derivatives of sui1Δ strain JCY03 containing the indicated SUI1 alleles (C) or SUI1-opt alleles (D) were cultured in SD supplemented with His, Trp, and uracil (Ura) at 30°C to an A600 of ∼1.0, and WCEs were subjected to Western analysis using antibodies against eIF1/Sui1 or eIF2Bε/Gcd6 (analyzed as a loading control). Two different amounts of each extract differing by a factor of 2 were loaded in successive lanes. Signal intensities were quantified from replicate experiments, and mean eIF1/Gcd6 ratios were normalized to that obtained for WT SUI1 to yield the relative (Rel.) eIF1/Gcd6 values listed below the blots. In panel D, the Rel. eIF1/Gcd6 ratios were normalized to that obtained for WT SUI1-opt to yield the Norm. eIF1/Gcd6 values. In panel E, the ratios of mean eIF1/Gcd6 values for SUI1 versus SUI1-opt alleles were calculated for each strain. (F) Western analysis of JCY03 derivatives containing sc or hc plasmids with sui1-L96P (lanes 1 and 2 and lanes 5 and 6, respectively) or sc sui1-opt-L96P (lanes 3 and 4), conducted as in panels C and D. (G) Derivatives of JCY03 harboring the indicated sc SUI1 alleles and sc plasmids with SUI1-lacZ (pPMB24) or SUI1-opt-lacZ (pPMB25) were cultured and assayed for β-galactosidase activities as in panel B. Mean SUI1-lacZ or SUI1-opt-lacZ expression levels determined from replicate measurements were normalized to those for WT to yield the relative (Rel.) expression values listed below the histogram, and the ratio of mean SUI1-lacZ versus SUI1-opt-lacZ expression is given on the bottom line. (H) Transformants of strain PMY30 harboring sc plasmids with SUI1-lacZ (pPMB24) or SUI1-opt-lacZ (pPMB25) and hc plasmids with SUI1-lacZ (pPMB26) or SUI1-opt-lacZ (pPMB27) reporters were cultured and assayed for β-galactosidase activities as in panel G.
Fig. 2.
Fig. 2.
Comparison of effects of Sui and Ssu mutations in eIF1, eIF2β, and eIF1A on eIF1 protein and SUI1 mRNA levels. (A) Northern analysis of SUI1 mRNA in selected mutants. Lanes 1 to 6 and lanes 12 to 17 show results for strains described in Fig. 1C and D and in Fig. 5A, B, and F containing the indicated SUI1+ alleles (lanes 1 to 6) or SUI1-opt alleles (lanes 12 to 17) cultured as in Fig. 1C. Lanes 7 to 11 and lanes 18 to 22 show the results for strains described in Fig. 6A and C containing SUI1+ (lanes 7 to 11) or SUI1-opt (lanes 18 to 22) cultured as described in Fig. 6A. Total RNA was subjected to Northern analysis of SUI1 and PYK1 mRNAs, the hybridization signals were quantified with a Phosphorimager, and ratios of SUI1 to PYK1 mRNA were calculated and normalized to the ratio obtained for the corresponding strain, harboring WT SUI1, SUI3, and TIF11. The resulting “Norm. SUI1/PYK1” values are listed below the blot and also in columns 3 and 7 of panel B. The WT SUI1 reference strain is shown in lane 1 for the mutants examined in lanes 1 to 6 and lanes 12 to 17. The WT SUI1 SUI3 reference strain is shown in lane 7 for the mutants examined in lanes 7 and 8 and lanes 18 and 19. The WT SUI1 TIF11 reference strain is shown in lane 9 for the mutants examined in lanes 9 to 11 and lanes 20 to 22. (B) Comparison of eIF1 protein and SUI1 mRNA levels. For the strains analyzed in panel A, the appropriate “Rel. eIF1/Gcd6” values taken from Fig. 1C and D, from Fig. 5A, B, and F, and from Fig. 6A and C are listed in columns 2 and 6 (eIF1/Gcd6 Protein) for SUI1 and SUI1-opt alleles, respectively; the “Norm. SUI1/PYK1” values from panel A are listed in columns 3 and 7 (SUI1/PYK1 mRNA); the ratios of values in columns 2 and 3 are listed in column 4 (Protein/mRNA); the ratios of values in columns 6 and 7 are listed in column 8 (Protein/mRNA); and the values in column 8 normalized to the cognate WT ratios in rows 12, 18, or 20 are listed in column 9 (Norm. Protein/mRNA).
Fig. 3.
Fig. 3.
Isolation of Ssu substitutions in eIF1. (A) Summary of genetic selection used to isolate Ssu alleles of SUI1 as suppressors of the recessive lethality of SUI5. The relevant genotype, the expression levels of his4-301 and PGAL-TIF5 (ON or OFF), and the growth phenotypes on medium containing galactose or glucose as carbon source are indicated for the parental strain (two rectangles on the left) and for Ssu sui1 mutants (two rectangles on the right). See the text for further details. (B) Ssu phenotypes of derivatives of a sui1Δ his4-301 PGAL-TIF5 strain with episomal SUI5 (PMY04) harboring the indicated SUI1 alleles. Tenfold serial dilutions of these strains plus strains PMY89 and PMY91 containing episomal TIF5 (p4119) or empty vector, versus SUI5 (last two rows) were spotted on SGal+His and SGal-His (containing 0.003 mM His). (C) In the top panel, the same strains as in panel B were streaked on SC containing 2% galactose, 1% raffinose as a carbon source, lacking Leu and tryptophan (Trp), and supplemented with 0.3 mM His (SGal+His). In the bottom panel, strains were streaked on SC lacking Leu and Trp and supplemented with 5-FOA (SC + 5-FOA). (D) Phenotypes of SUI1 Ssu mutations in the absence of SUI5. Derivatives of sui1Δ his4-301 strain JCY03 containing the indicated SUI1 alleles were analyzed as in Fig. 1A.
Fig. 4.
Fig. 4.
SUI1 Ssu mutations reduce the HIS4 UUG/AUG initiation ratio in SUI5 and SUI3-2 cells. (A to C) Derivatives of sui1Δ his4-301-myc SUI5 (A) and sui1Δ HIS4-myc SUI5 (B) strains JCY04 and PMY16, respectively, harboring the indicated SUI1 alleles were cultured as in Fig. 1C, and WCEs were subjected to Western analysis with antibodies against myc epitope or Gcd6. Two different amounts of each extract differing by a factor of 2 were loaded in successive lanes. (C) Western signals from panels A and B were quantified, and the mean ratios of his4-301-myc to His4-myc (each normalized to Gcd6) are plotted with the SEM as error bars. (D) Derivatives of JCY03 containing episomal SUI3-2 (p4280/YCpSUI3-S264Y-W) and harboring the indicated SUI1 alleles were analyzed for Slg and His+/Sui phenotypes by spotting serial 10-fold dilutions on SC lacking Leu and Trp and supplemented with either 0.3 mM His (+His) or 0.003 mM His (−His). (E) Transformants of the SUI3-2 strains from panel D containing the AUG or UUG HIS4-lacZ reporters were analyzed as in Fig. 1B.
Fig. 5.
Fig. 5.
SUI1 Ssu mutations reduce SUI1 expression by exacerbating poor context. (A to C) SUI1 Ssu mutations reduce eIF1 expression dependent on SUI1+ AUG context. Derivatives of JCY03 containing the indicated SUI1 alleles (A) or SUI1-opt alleles (B) were subjected to Western analysis as in Fig. 1C. Two different amounts of each extract differing by a factor of 2 were loaded in successive lanes. (C) Ratios of mean eIF1/Gcd6 values for SUI1 versus SUI1-opt alleles were calculated as in Fig. 1E. (D) Derivatives of JCY03 harboring the indicated SUI1 alleles and the SUI1-lacZ or SUI1-opt-lacZ reporter were analyzed for β-galactosidase activities as in Fig. 1G. (E) SUI1-lacZ and SUI1-opt-lacZ expression levels were determined in derivatives of JCY03 containing sc SUI1, hc SUI, or hc SUI1-opt, as indicated, as in Fig. 1G. (F) Western analysis of eIF1 expression in JCY03 derivatives containing the indicated sc or hc SUI1 alleles, conducted as in Fig. 1C.
Fig. 6.
Fig. 6.
Sui mutations in eIF2β and eIF1A suppress the poor AUG context at SUI1. (A) Derivatives of sui1Δ PGAL-SUI3 strain PMY02 containing plasmid-borne SUI3 (p4450) or SUI3-2 (p4280) and either sc SUI1+ or sc SUI1-opt were cultured continuously in SD supplemented with His and Ura (with repression of chromosomal PGAL-SUI3) and subjected to Western analysis of eIF1 expression, as in Fig. 1C. Two different amounts of each extract differing by a factor of 2 were loaded in successive lanes. (B) Analysis of SUI1-lacZ and SUI1-opt-lacZ expression in the SUI1+ strains from panel A conducted as in Fig. 1G. (C) Western analysis of eIF1 in derivatives of sui1Δ PGAL-TIF11 strain PMY03 containing plasmid-borne TIF11+ (pDSO9), tif11-SE1*,SE2*+F131(pAS23), or tif11-17-21 (p4552), and either sc SUI1+ or sc SUI1-opt, conducted as in panel A. (D) Ratios of mean eIF1/Gcd6 values for SUI1 versus SUI1-opt alleles calculated for strains analyzed in panels A and C. (E) Analysis of SUI1-lacZ and SUI1-opt-lacZ expression in transformants of the strains from the SUI1+ strains from panel C, as in Fig. 1G.
Fig. 7.
Fig. 7.
The eIF5 Sui mutation SUI5 does not suppress poor AUG context at SUI1. (A and C). Western analysis of eIF1 expression in derivatives of sui1Δ PGAL-TIF5 strain PMY01 containing plasmid-borne TIF5-FL (p4119), empty vector (YCplac22) or SUI5 (p4281) and either sc SUI1+ or sc SUI1-opt, conducted as in Fig. 1C except that strains were cultured in synthetic minimal medium with 2% galactose as carbon source and histidine and uracil supplements (SGal+HU) (A) and then shifted to SD+HU for 15 h (C). Two different amounts of each extract differing by a factor of 2 were loaded in successive lanes. (B and D) Analysis of SUI1-lacZ and SUI1-opt-lacZ expression in transformants of SUI1+ strains from panels A and C, cultured as described there.
Fig. 8.
Fig. 8.
Sui and Ssu mutations in eIF1, eIF2β and eIF1A modulate the deleterious effects of the U−3-U−2-U−1-AUG context. (A to C). Analysis of expression of reporter plasmids SUI1-lacZ (pMB24), SUI1UUU-lacZ (pMB28), and SUI1-opt-lacZ (pMB25) in derivatives of sui1Δ his4-301 strain JCY03 containing the indicated sc SUI1 alleles (A), derivatives of sui1Δ PGAL-SUI3 strain PMY02 containing plasmid-borne SUI3 (p4450) or SUI3-2 (p4280) and sc SUI1+ (pJCB101) (B), and derivatives of sui1Δ PGAL-TIF11 strain PMY03 containing plasmid-borne TIF11+ (pDSO9), tif11-SE1*, SE2*+F131 (pAS23), or tif11-17-21 (p4552), and sc SUI1+ (pJCB101) (C), as in Fig. 1G.
Fig. 9.
Fig. 9.
Specific domains or residues in eIF1, eIF1A and eIF2β discriminate against both poor AUG context and non-AUG start codons to maintain optimal initiation accuracy. In the WT, these initiation factors promote recognition of AUG start codons in optimal context (−3AAA) and impede recognition of initiation sites with poor context, such as the −3CGU sequence at SUI1, or with a non-AUG start codon such as UUG. Sui mutations affecting any of these factors render initiation less accurate by diminishing antagonism of start sites with either poor context or a non-AUG start codon. Ssu mutations affecting eIF1 or eIF1A render initiation hyperaccurate by increasing antagonism of start sites with either poor context or a non-AUG start codon.

Similar articles

Cited by

References

    1. Algire M. A., Maag D., Lorsch J. R. 2005. Pi release from eIF2, not GTP hydrolysis, is the step controlled by start-site selection during eukaryotic translation initiation. Mol. Cell 20: 251–262 - PubMed
    1. Baim S. B., Sherman F. 1988. mRNA structures influencing translation in the yeast Saccharomyces cerevisiae. Mol. Cell. Biol. 8: 1591–1601 - PMC - PubMed
    1. Boeke J. D., Trueheart J., Natsoulis G., Fink G. R. 1987. 5-fluoroorotic acid as a selective agent in yeast molecular genetics. Methods Enzymol. 154: 164–175 - PubMed
    1. Bushman J. L., Foiani M., Cigan A. M., Paddon C. J., Hinnebusch A. G. 1993. Guanine nucleotide exchange factor for eIF-2 in yeast: genetic and biochemical analysis of interactions between essential subunits GCD2, GCD6, and GCD7 and regulatory subunit GCN3. Mol. Cell. Biol. 13: 4618–4631 - PMC - PubMed
    1. Butler J. S., Springer M., Dondon J., Graffe M., Grunberg-Manago M. 1986. Escherichia coli protein synthesis initiation factor IF3 controls its own gene expression at the translational level in vivo. J. Mol. Biol. 192: 767–780 - PubMed

Publication types

MeSH terms

Substances