. 2012 Feb;5(2):266-75.
doi: 10.1158/1940-6207.CAPR-11-0004. Epub 2011 Sep 19.

Dispersal evolution in neoplasms: the role of disregulated metabolism in the evolution of cell motility

Affiliations

Dispersal evolution in neoplasms: the role of disregulated metabolism in the evolution of cell motility

C Athena Aktipis et al. Cancer Prev Res (Phila). 2012 Feb.

Abstract

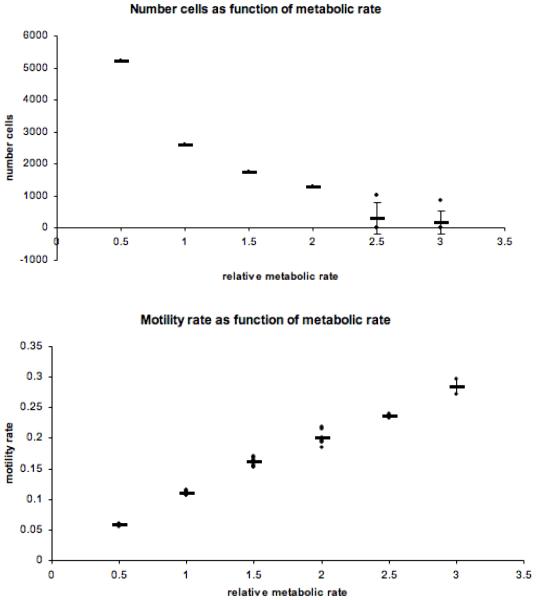
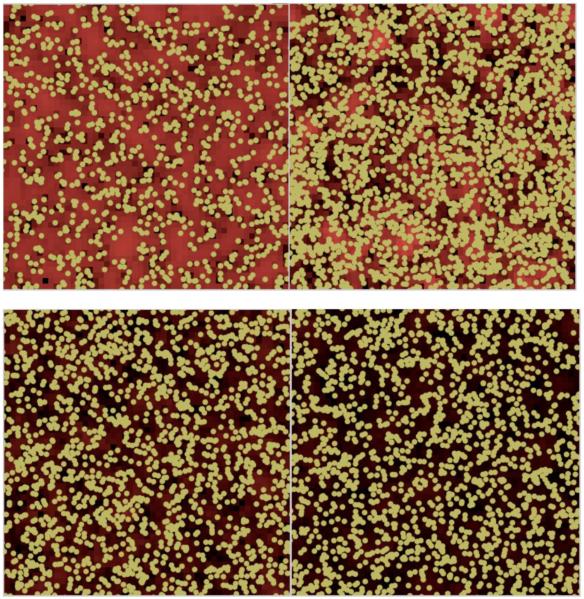
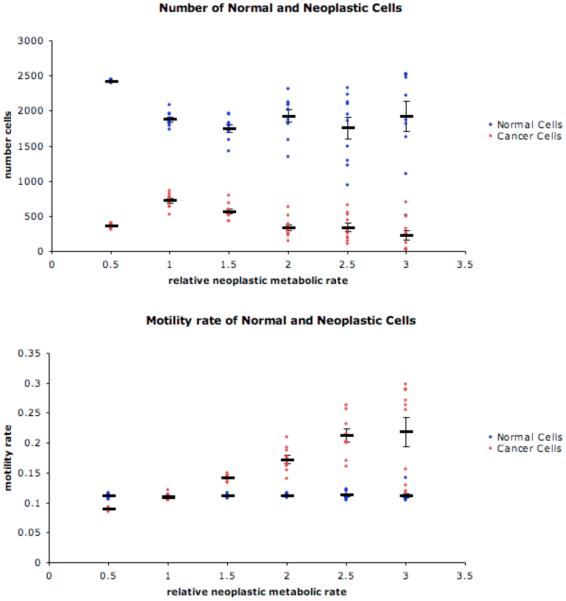
Here, we apply the theoretical framework of dispersal evolution to understand the emergence of invasive and metastatic cells. We investigate whether the dysregulated metabolism characteristic of cancer cells may play a causal role in selection for cell motility, and thus to the tissue invasion and metastasis that define cancer. With an agent-based computational model, we show that cells with higher metabolism evolve to have higher rates of movement and that "neoplastic" cells with higher metabolism rates are able to persist in a population of "normal" cells with low metabolic rates, but only if increased metabolism is accompanied by increased motility. This is true even when the cost of motility is high. These findings suggest that higher rates of cell metabolism lead to selection for motile cells in premalignant neoplasms, which may preadapt cells for subsequent invasion and metastasis. This has important implications for understanding the progression of cancer from less invasive to more invasive cell types.


Figures

Figure 1
Figure 1
Screen shot of initial state of the model (for both experiments 1 and 2) Yellow circles represent cells and concentration of resources in each lattice location is indicated by lighter shades of red/pink. Each lattice location produces enough resources in each time period to support a single cell with normal metabolism. Initially cells are arranged systematically (as in organized tissues), with one cell per lattice location.
Figure 2
Figure 2
a) As the relative metabolic rate increases, the number of cells at the end of each run is lower. b) Cells evolve to have higher motility rates (means with error bars) when metabolic rate is higher.
Figure 3
Figure 3
Screen shots from experiment 1. Cells have a relative metabolic rate of 1.5 (consuming 1.5 times as many resources per time period as normal cells). a) At time 5,000, the population size has decreased substantially and high resource patchiness is apparent (with lighter shades of red signifying more resources). Cells with higher motility are favored because they can gain access to new resource rich regions. b) At time 10,000, the population size increased and cells have begun moving into the resource rich areas. c) By time 20,000, most resource rich areas have been colonized by cells. d) Some resource patchiness remains even after 100,000, contributing to continued selection for cell motility.
Figure 4
Figure 4
a) The number of neoplastic and normal cells (means with error bars) at the end of each run is shown for various neoplastic metabolic rates. b) Higher rates of metabolism of neoplastic cells led to higher rates of mobility for neoplastic cells (means with error bars).
Figure 5
Figure 5
Screen shots from experiment 2. Yellow cells represent normal cells with a consumption rate of 1 and blue cells represent neoplastic cells (relative metabolic rate of 1.5). a) At time 5,000, some neoplastic cells have emerged due to background mutation. b) By time 10,000, the number of neoplastic cells has increased. c) Neoplastic cells continue to increase in the population at time 20,000. d) Neoplastic cells do not take over the population, but instead coexist with normal cells (time 100,000). Throughout, neoplastic cells (i.e., cells with a higher metabolic rate) evolve higher rates of motility while normal cells motility rate remains low (see Figure 6).
Figure 6
Figure 6
a) The number of neoplastic and normal cells (means with error bars) at the end of each run is shown for various motility costs. b) Higher mobility costs led to lower rates of mobility for both normal and neoplastic cells (means with error bars). However, selection still leads to higher mobility in the neoplastic cells compared to the normal cells in all cases.

References

    1. Cairns J. Mutation selection and the natural history of cancer. Nature. 1975;255:197–200. - PubMed
    1. Merlo LF, Pepper JW, Reid BJ, Maley CC. Cancer as an evolutionary and ecological process. Nature reviews Cancer. 2006;6:924–35. - PubMed
    1. Smalley KSM, Brafford PA, Herlyn M. Selective evolutionary pressure from the tissue microenvironment drives tumor progression. Seminars in Cancer Biology. 2005;15:451–9. - PubMed
    1. Ye C, Stevens JB, Liu G, Bremer SW, Jaiswal AS, Ye KJ, et al. Genome based cell population heterogeneity promotes tumorigenicity: The evolutionary mechanism of cancer. Journal of Cellular Physiology. 2009;219:288–300. - PMC - PubMed
    1. Pepper JW, Findlay SC, Kassen R, Spencer SL, Maley CC. Cancer research meets evolutionary biology. Evolutionary Applications. 2009;2:62–70. - PMC - PubMed

Publication types