. 2012 Jan;22(1):84-94.
doi: 10.1101/gr.124099.111. Epub 2011 Sep 19.

A genomic model of condition-specific nucleosome behavior explains transcriptional activity in yeast

Affiliations

A genomic model of condition-specific nucleosome behavior explains transcriptional activity in yeast

Judith B Zaugg et al. Genome Res. 2012 Jan.

Abstract

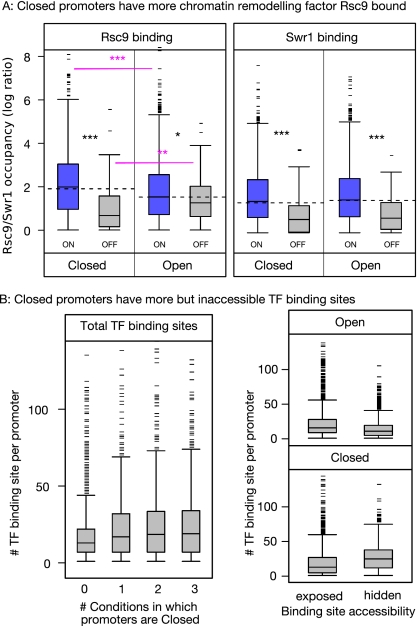
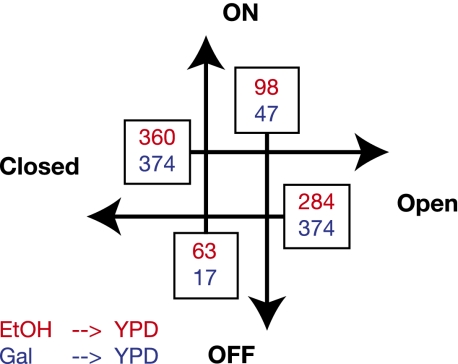
Nucleosomes play an important role in gene regulation. Molecular studies observed that nucleosome binding in promoters tends to be repressive. In contrast, genomic studies have delivered conflicting results: An analysis of yeast grown on diverse carbon sources reported that nucleosome occupancies remain largely unchanged between conditions, whereas a study of the heat-shock response suggested that nucleosomes get evicted at promoters of genes with increased expression. Consequently, there are few general principles that capture the relationship between chromatin organization and transcriptional regulation. Here, we present a qualitative model for nucleosome positioning in Saccharomyces cerevisiae that helps explain important properties of gene expression. By integrating publicly available data sets, we observe that promoter-bound nucleosomes assume one of four discrete configurations that determine the active and silent transcriptional states of a gene, but not its expression level. In TATA-box-containing promoters, nucleosome architecture indicates the amount of transcriptional noise. We show that >20% of genes switch promoter states upon changes in cellular conditions. The data suggest that DNA-binding transcription factors together with chromatin-remodeling enzymes are primarily responsible for the nucleosome architecture. Our model for promoter nucleosome architecture reconciles genome-scale findings with molecular studies; in doing so, we establish principles for nucleosome positioning and gene expression that apply not only to individual genes, but across the entire genome. The study provides a stepping stone for future models of transcriptional regulation that encompass the intricate interplay between cis- and trans-acting factors, chromatin, and the core transcriptional machinery.


Figures

Figure 1.
Figure 1.
Classification of promoters based on distance between +1 and −1 nucleosome position. (A) Comparison of NFR sizes for ON and OFF genes in three different conditions. Distributions of NFR sizes for ON (blue lines) and OFF genes (gray lines) in YPD1, EtOH, and Gal (from left to right). Expressed genes tend to have larger NFRs than unexpressed ones; however, for both expression states, NFR sizes fall into bimodal distributions with minima ∼80 bp (red dotted line). NFRs were classified into Open and Closed states based on this threshold. (B) Position of +1 and −1 nucleosomes relative to the TSS in Open and Closed promoters. Distribution of distances (in bp) from the TSS to the midpoints of the −1 and +1 nucleosomes in promoters of ON (blue) and OFF genes (gray) in YPD. Promoters were separated into those with Open (left) or Closed NFRs (right). The +1 nucleosome is well-positioned in ON genes compared with OFF. In contrast, the −1 nucleosome is well-defined for genes with Open/ON NFRs, but relatively poorly for genes with Closed NFRs. (C) Properties of promoter nucleosomes in Open and Closed promoters. Distributions of occupancy (top) and focus (bottom) for −1 and +1 nucleosomes in promoters with Open and Closed NFR configurations. Genes were separated into ON (blue) OFF (gray). In all cases, the +1 nucleosome is more highly occupied and better focused in the ON state. The −1 nucleosomes in Closed promoters, however, shows the opposite pattern with less occupancy and focus in the ON than in the OFF state. Wilcoxon rank sum test, P-value <0.05 (*), <0.01 (**), and <0.001 (***).
Figure 2.
Figure 2.
Model of promoter nucleosome architecture in yeast. Schematic of the four-state model. It summarizes the observations of nucleosome positioning, gene expression behavior, and regulatory influences.
Figure 3.
Figure 3.
Phase transitions between promoter states. (A) Phase transition of +1 properties at ON/OFF boundary. The occupancy, binding focus, and the deviation from the median distance to the TSS (from top to bottom) for the +1 nucleosome are plotted against the rank of gene expression. The values were standardized and smoothed by a sliding window (window 200, step size 20). The median (black), 25%–75% quantiles (gray), and 5%–95% quantiles (white) are shown. A phase transition is observed at the boundary between ON an OFF genes. The red lines indicate the boundary for ON/OFF genes obtained from expression data with 1% and 5% FDR. The sudden fall in occupancy and focus toward the very highly expressed genes might suggest that nucleosomes get evicted upon very high expression. (B) Phase transition of +1 and −1 properties at Open/Closed boundary. The occupancy and focus for the +1 and −1 nucleosome are plotted against the rank of the NFR size. The values were standardized and smoothed by a sliding window, and the median (black dashed lines), 25%–75% quantiles (gray), and 5%–95% quantiles (white) are shown. A phase transition was observed for the −1 nucleosomes but not for the +1 nucleosomes. The red lines indicate the 60–90-bp window found in Figure 1A to mark the boundary between Open and Closed promoters.
Figure 4.
Figure 4.
Effects on the promoter nucleosomes on expression levels and expression noise. (A) No correlation between promoter nucleosome properties and expression levels. NFR size and occupancy of +1 and −1 nucleosomes are plotted against gene expression values (top to bottom) for Open and Closed promoters separately. No correlation is observed with R2 < 0.04. (B) Correlations between transcription machinery binding and expression levels. In contrast to nucleosome properties, the transcription machinery binding correlates nicely with expression levels with R2 between 0.2 and 0.3. (C) Closed promoters tend to have noisier expression. Distributions of gene-expression noise for TATA-containing and TATA-less promoters in Open and Closed configurations. TATA-less promoters (top panel) show significantly lower noise than TATA-containing ones (bottom panel; compare box-plots joined by red lines). Among the latter, Closed promoters show even more noise than Open promoters. There is no difference in noise levels between the two architectures among TATA-less promoters. P-values were calculated using the Wilcoxon rank sum test.
Figure 5.
Figure 5.
Different regulation of Open and Closed promoters by remodeling factors and TFs. (A) Closed promoters have more remodeling factor Rsc9 bound. Distributions of Rsc9 (left) and Swr1 (right) occupancy in Open and Closed promoters for ON (blue) and OFF genes (gray). Swr1 is present only in ON genes regardless of promoter state. In contrast, Rsc9 shows more binding to Closed promoters among ON genes and more binding to Open NFRs among OFF genes (compare box-plots joined by red lines). Wilcoxon rank sum test, P-value <0.05 (*), <0.01 (**), and <0.001 (***). (B) Closed NFRs have more but inaccessible TF-binding sites. Distributions of numbers of TF-binding sites for promoters that have a Closed NFR state in 0, 1, 2, or 3 growth conditions (left). Promoters that are never Closed have fewer binding sites than others. Distributions of numbers of binding sites that are exposed or hidden by nucleosomes in Open and Closed promoters (right). Open promoters tend to have fewer binding sites in total compared with Closed promoters; but these sites tend to be exposed.
Figure 6.
Figure 6.
Promoter state transitions. The numbers of promoters that switch between the four promoter states are shown for the transitions EtOH to YPD (blue) and Gal to YPD (red).

Similar articles

Cited by

References

    1. Adkins MW, Tyler JK 2006. Transcriptional activators are dispensable for transcription in the absence of Spt6-mediated chromatin reassembly of promoter regions. Mol Cell 21: 405–416 - PubMed
    1. Albert I, Mavrich TN, Tomsho LP, Qi J, Zanton SJ, Schuster SC, Pugh BF 2007. Translational and rotational settings of H2A.Z nucleosomes across the Saccharomyces cerevisiae genome. Nature 446: 572–576 - PubMed
    1. Albert I, Wachi S, Jiang C, Pugh BF 2008. GeneTrack—a genomic data processing and visualization framework. Bioinformatics 24: 1305–1306 - PMC - PubMed
    1. Arkin A, Ross J, McAdams HH 1998. Stochastic kinetic analysis of developmental pathway bifurcation in phage λ-infected Escherichia coli cells. Genetics 149: 1633–1648 - PMC - PubMed
    1. Basehoar AD, Zanton SJ, Pugh BF 2004. Identification and distinct regulation of yeast TATA box-containing genes. Cell 116: 699–709 - PubMed

Publication types

MeSH terms

LinkOut - more resources