. 2011 Oct 4;108(40):16849-54.
doi: 10.1073/pnas.1108491108. Epub 2011 Sep 19.

Optimal defocus estimation in individual natural images

Affiliations

Optimal defocus estimation in individual natural images

Johannes Burge et al. Proc Natl Acad Sci U S A. .

Abstract

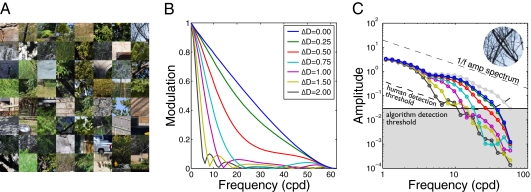
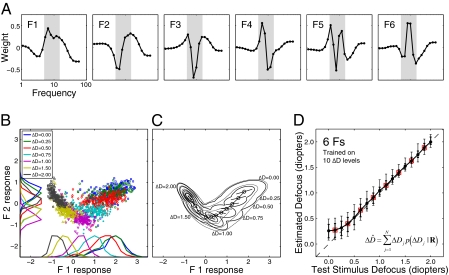
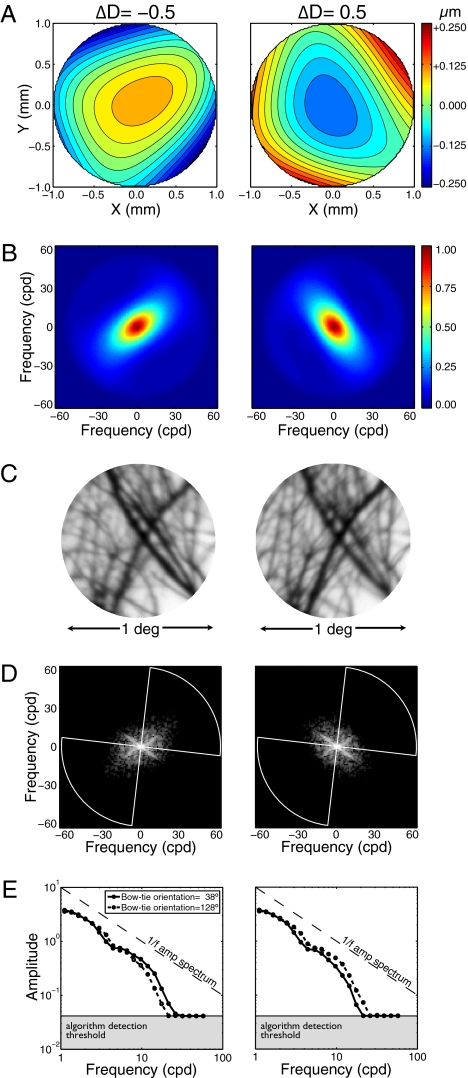
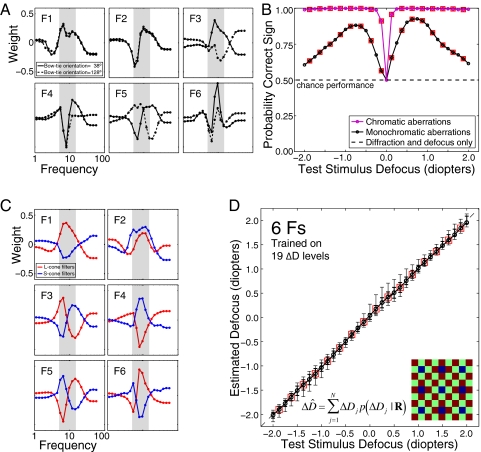
Defocus blur is nearly always present in natural images: Objects at only one distance can be perfectly focused. Images of objects at other distances are blurred by an amount depending on pupil diameter and lens properties. Despite the fact that defocus is of great behavioral, perceptual, and biological importance, it is unknown how biological systems estimate defocus. Given a set of natural scenes and the properties of the vision system, we show from first principles how to optimally estimate defocus at each location in any individual image. We show for the human visual system that high-precision, unbiased estimates are obtainable under natural viewing conditions for patches with detectable contrast. The high quality of the estimates is surprising given the heterogeneity of natural images. Additionally, we quantify the degree to which the sign ambiguity often attributed to defocus is resolved by monochromatic aberrations (other than defocus) and chromatic aberrations; chromatic aberrations fully resolve the sign ambiguity. Finally, we show that simple spatial and spatio-chromatic receptive fields extract the information optimally. The approach can be tailored to any environment-vision system pairing: natural or man-made, animal or machine. Thus, it provides a principled general framework for analyzing the psychophysics and neurophysiology of defocus estimation in species across the animal kingdom and for developing optimal image-based defocus and depth estimation algorithms for computational vision systems.


Conflict of interest statement

The authors declare no conflict of interest.

Figures

Fig. 1.
Fig. 1.
Natural scene inputs and the effect of defocus in a diffraction- and defocus-limited vision system. (A) Examples of natural inputs. (B) Optical effect of defocus. Curves show one-dimensional modulation transfer functions (MTFs), the radially averaged Fourier amplitude spectra of the point-spread functions. (C) Radially averaged amplitude spectra of the top-rightmost patch in A. Circles indicate the mean amplitude in each radial bin. Light gray circles show the spectrum of the idealized natural input. The dashed black curve shows the human neural detection threshold.
Fig. 2.
Fig. 2.
Optimal filters and defocus estimation. (A) The first six AMA filters. Filter energy is concentrated in a limited frequency range (shaded area). (B) Filter responses to amplitude spectra in the training set (1.25, 1.75, and 2.25 diopters not plotted). Symbols represent joint responses from the two most informative filters. Marginal distributions are shown on each axis. (C) Gaussian fits to filter responses. Thick lines are iso-likelihood contours on the maximum-likelihood surface determined from fits to the response distributions at trained defocus levels. Thin lines are iso-likelihood contours on interpolated response distributions (SI Methods). Circles indicate interpolated means separated by a d′ (i.e., Mahalanobis distance) of 1. Line segments show the direction of principle variance and ±1 SD. (D) Defocus estimates for test stimuli. Circles represent the mean defocus estimate for each defocus level. Error bars represent 68% (thick bars) and 90% (thin bars) confidence intervals. Boxes indicate defocus levels not in the training set. The equal-sized error bars at both trained and untrained levels indicates that the algorithm outputs continuous estimates.
Fig. 3.
Fig. 3.
Effect of defocus sign in a vision system with human monochromatic aberrations. (A) Wavefront aberration functions of the first author's right eye for −0.5 and +0.5 diopters of defocus (x and y represent location in the pupil aperture). Color indicates wavefront errors in micrometers. (B) Corresponding 2D MTFs. Orientation differences are due primarily to astigmatism. Color indicates transfer magnitude. (C) Image patch defocused by −0.5 and +0.5 diopters. Relative sharpness of differently oriented image features changes as a function of defocus sign. (D) Logged 2D-sampled retinal image amplitude spectra. The spectra were radially averaged within two “bowties” (one shown, white lines) that were centered on the dominant orientations of the negatively and positively defocused MTFs (SI Methods). (E) Thresholded bowtie amplitude spectra. Curves show the bowtie amplitude spectra at the dominant orientations of the negatively and positively defocused MTFs (solid and dashed curves, respectively).
Fig. 4.
Fig. 4.
Optimal filters and defocus estimates for vision systems with human monochromatic or chromatic aberrations. (A) Optimal filters for a vision system with the optics of the first author's right eye and a sensor array sensitive only to 570 nm light. Solid lines show filter sensitivity to orientations in the “bowtie” centered on the dominant orientation of the negatively defocused MTF (Fig. 3 D and E). Dotted lines show filter sensitivities to the other orientations. (B) Defocus sign identification. The black curve shows performance for a vision system with the first author's monochromatic aberrations. The magenta curve shows performance for a system sensitive to chromatic aberration. (C) Optimal filters for the system sensitive to chromatic aberrations. Red curves show L-cone filters. Blue curves show S-cone filters. Inset in D shows the rectangular mosaic of L (red), M (green), and S (blue) cones used to sample the retinal images (57, 57, and 14 samples/degree, respectively). M-cone responses were not used in the analysis. (D) Defocus estimates using the filters in C. Error bars represent the 68% (thick bars) and 90% (thin bars) confidence intervals on the estimates. Boxes mark defocus levels not in the training set. Error bars at untrained levels are as small as at trained levels, indicating that the algorithm makes continuous estimates.

References

    1. Held RT, Cooper EA, O'Brien JF, Banks MS. Using blur to affect perceived distance and size. ACM Trans Graph. 2010;29(2):19.1–19.16. - PMC - PubMed
    1. Vishwanath D, Blaser E. Retinal blur and the perception of egocentric distance. J Vis. 2010;10:26:1–16. - PubMed
    1. Kruger PB, Mathews S, Aggarwala KR, Sanchez N. Chromatic aberration and ocular focus: Fincham revisited. Vision Res. 1993;33:1397–1411. - PubMed
    1. Kruger PB, Mathews S, Katz M, Aggarwala KR, Nowbotsing S. Accommodation without feedback suggests directional signals specify ocular focus. Vision Res. 1997;37:2511–2526. - PubMed
    1. Wallman J, Winawer J. Homeostasis of eye growth and the question of myopia. Neuron. 2004;43:447–468. - PubMed

Publication types

LinkOut - more resources