

Investigating the electrophysiological basis of resting state networks using magnetoencephalography
- PMID: 21930901
- PMCID: PMC3189080
- DOI: 10.1073/pnas.1112685108
Investigating the electrophysiological basis of resting state networks using magnetoencephalography
Abstract
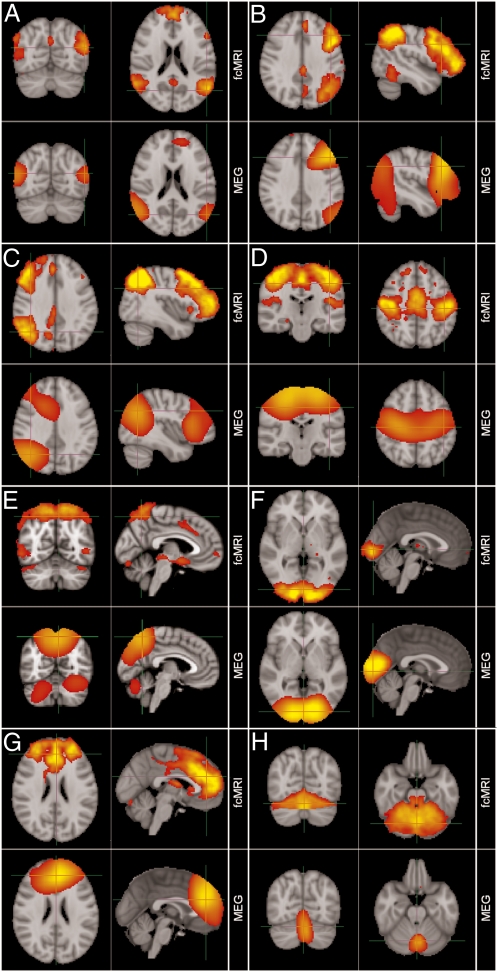
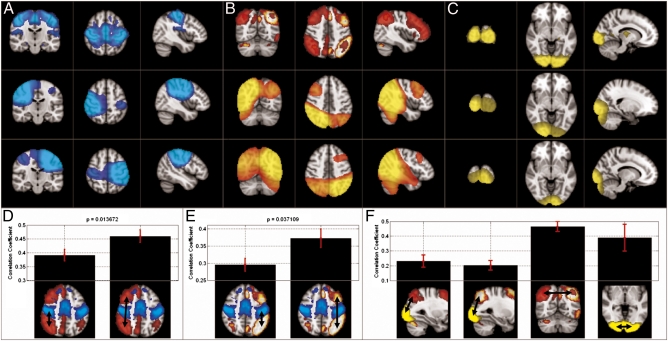
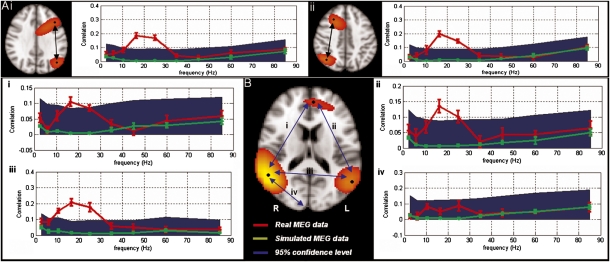
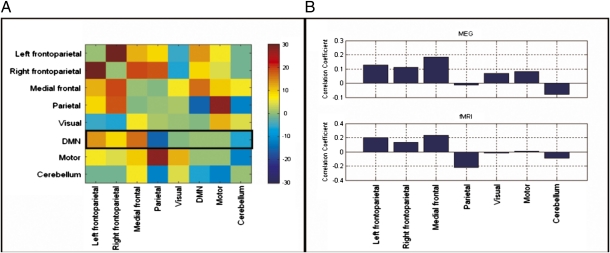
In recent years the study of resting state brain networks (RSNs) has become an important area of neuroimaging. The majority of studies have used functional magnetic resonance imaging (fMRI) to measure temporal correlation between blood-oxygenation-level-dependent (BOLD) signals from different brain areas. However, BOLD is an indirect measure related to hemodynamics, and the electrophysiological basis of connectivity between spatially separate network nodes cannot be comprehensively assessed using this technique. In this paper we describe a means to characterize resting state brain networks independently using magnetoencephalography (MEG), a neuroimaging modality that bypasses the hemodynamic response and measures the magnetic fields associated with electrophysiological brain activity. The MEG data are analyzed using a unique combination of beamformer spatial filtering and independent component analysis (ICA) and require no prior assumptions about the spatial locations or patterns of the networks. This method results in RSNs with significant similarity in their spatial structure compared with RSNs derived independently using fMRI. This outcome confirms the neural basis of hemodynamic networks and demonstrates the potential of MEG as a tool for understanding the mechanisms that underlie RSNs and the nature of connectivity that binds network nodes.
Conflict of interest statement
The authors declare no conflict of interest.
Figures
References
-
- Schnitzler A, Gross J. Normal and pathological oscillatory communication in the brain. Nat Rev Neurosci. 2005;6:285–296. - PubMed
-
- Uhlhaas PJ, Singer W. Abnormal neural oscillations and synchrony in schizophrenia. Nat Rev Neurosci. 2010;11:100–113. - PubMed
-
- Biswal B, Yetkin FZ, Haughton VM, Hyde JS. Functional connectivity in the motor cortex of resting human brain using echo-planar MRI. Magn Reson Med. 1995;34:537–541. - PubMed
-
- Fox MD, Raichle ME. Spontaneous fluctuations in brain activity observed with functional magnetic resonance imaging. Nat Rev Neurosci. 2007;8:700–711. - PubMed
Publication types
MeSH terms
Grants and funding
LinkOut - more resources
Full Text Sources
Other Literature Sources
Molecular Biology Databases
Miscellaneous
