

Dynamics and dissipation in enzyme catalysis
- PMID: 21930950
- PMCID: PMC3182692
- DOI: 10.1073/pnas.1106397108
Dynamics and dissipation in enzyme catalysis
Abstract
We use quantized molecular dynamics simulations to characterize the role of enzyme vibrations in facilitating dihydrofolate reductase hydride transfer. By sampling the full ensemble of reactive trajectories, we are able to quantify and distinguish between statistical and dynamical correlations in the enzyme motion. We demonstrate the existence of nonequilibrium dynamical coupling between protein residues and the hydride tunneling reaction, and we characterize the spatial and temporal extent of these dynamical effects. Unlike statistical correlations, which give rise to nanometer-scale coupling between distal protein residues and the intrinsic reaction, dynamical correlations vanish at distances beyond 4-6 Å from the transferring hydride. This work finds a minimal role for nonlocal vibrational dynamics in enzyme catalysis, and it supports a model in which nanometer-scale protein fluctuations statistically modulate--or gate--the barrier for the intrinsic reaction.
Conflict of interest statement
The authors declare no conflict of interest.
Figures
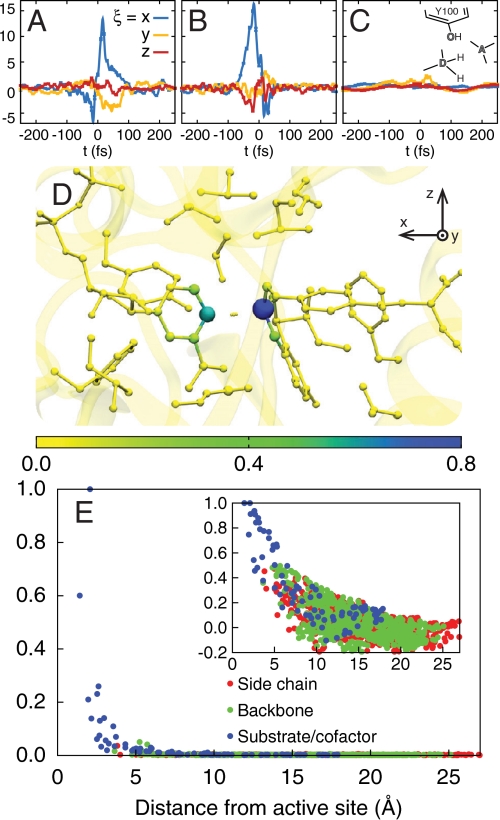
 , plotted for (A) the donor atom, (B) the acceptor atom, and (C) the side-chain O atom in the Y100 residue of the active site. (D) The size and color of atoms in the active-site region are scaled according to the integrated dynamical correlation measure, fi. (E) (Main panel) The integrated dynamical correlation measure, fi, as a function of the distance of atom i from the midpoint of the donor and acceptor atoms. (Inset) The statistical correlation measure,
  , is similarly presented. Atoms corresponding to the protein side chains, the protein backbone, and the substrate/cofactor regions are indicated by color. Values presented in part A are in units of nm/ps, and values in parts D and E are normalized to a maximum of unity. The estimated error in part E is smaller than the dot size.
References
-
- Henzler-Wildman KA, et al. Intrinsic motions along an enzymatic reaction trajectory. Nature. 2007;450:838–844. - PubMed
-
- Cook PF, Cleland WW. Enzyme Kinetics and Mechanism. New York: Garland Science; 2007.
Publication types
MeSH terms
Substances
LinkOut - more resources
Full Text Sources
Other Literature Sources
