

Interaction of Ras with p110γ is required for thymic β-selection in the mouse
- PMID: 21930962
- PMCID: PMC3198841
- DOI: 10.4049/jimmunol.1101949
Interaction of Ras with p110γ is required for thymic β-selection in the mouse
Abstract
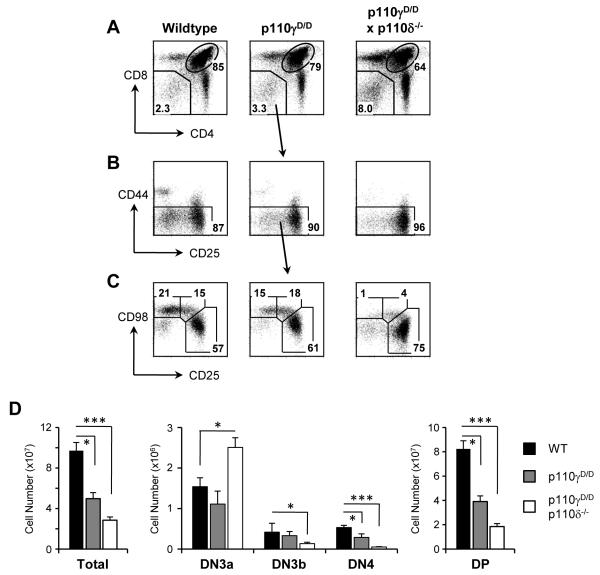
Thymocytes are tested for productive rearrangement of the tcrb locus by expression of a pre-TCR in a process termed β-selection, which requires both Notch1 and CXCR4 signaling. It has been shown that activation of the GTPase Ras allows thymocytes to proliferate and differentiate in the absence of a Pre-TCR; the direct targets of Ras at this checkpoint have not been identified, however. Mice with a mutant allele of p110γ unable to bind active Ras revealed that CXCR4-mediated PI3K activation is Ras dependent. The Ras-p110γ interaction was necessary for efficient β-selection-promoted proliferation but was dispensable for the survival or differentiation of thymocytes. Uncoupling Ras from p110γ provides unambiguous identification of a Ras interaction required for thymic β-selection.
Figures
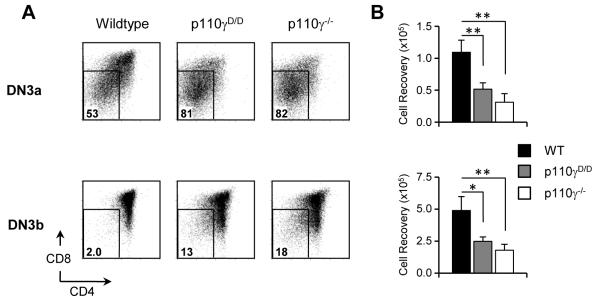
 and p110γ−/− (□) cultures after three days. The seeding number for each cell type was 5 × 10⁴ DN3a and 2.5 × 10⁴ DN3b. Graphs show the mean and SD from 3 independent groups.
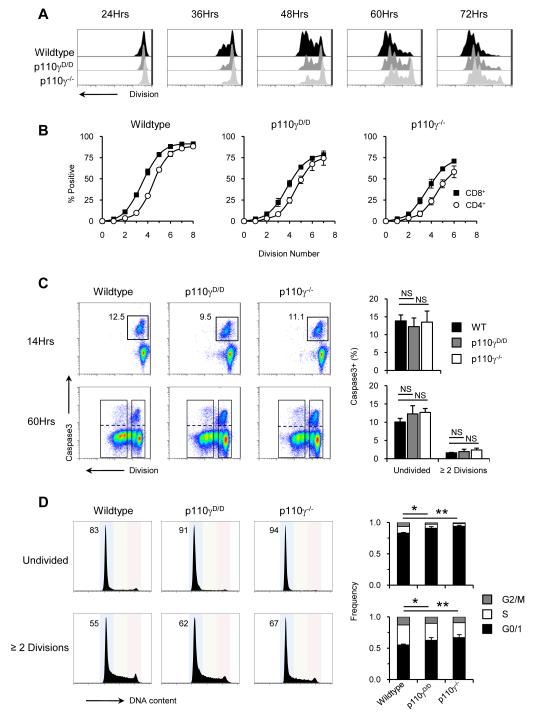
 and p110γ−/− = □. (D) DNA content profiles from cells cultured for 60hrs. The gating strategy used to identify divided and undivided populations is the same as in Figure 3D. Coloured background on FACS plots show the delineation of cells in G0/1 (blue), S (green) and G2/M (red). Numbers on FACS plots show percentage of cells in G0/1. Graphs show data from three independent experiments where G0/1 = ■, S = □ and G2/M =
  . For all statistical analysis a repeated measures ANOVA test was performed. NS = not significant, * = p<0.05, ** = p<0.01.
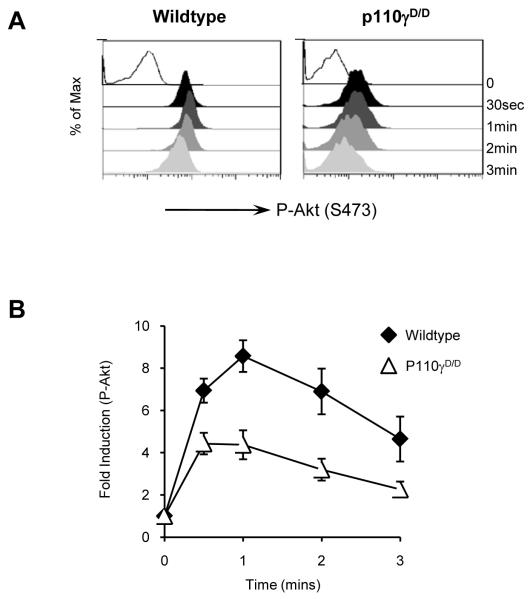
 ) DN3 cells after SDF1α stimulation. Graph shows the mean and SD from analysis of five mice.
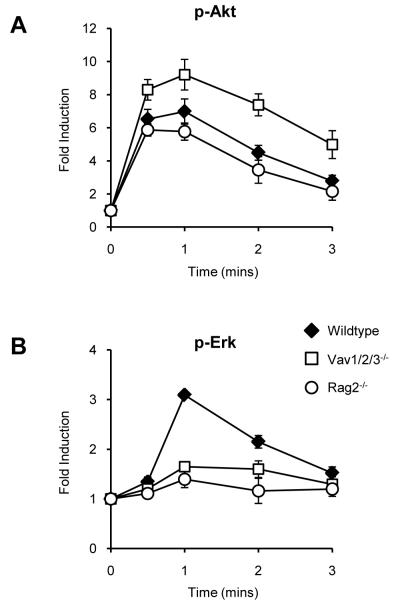
 ), Vav1/2/3−/− (□) and Rag2−/− (○) DN3 cells after stimulation with 10nM SDF1α. Graph shows the mean and SD from analysis of four-six mice.
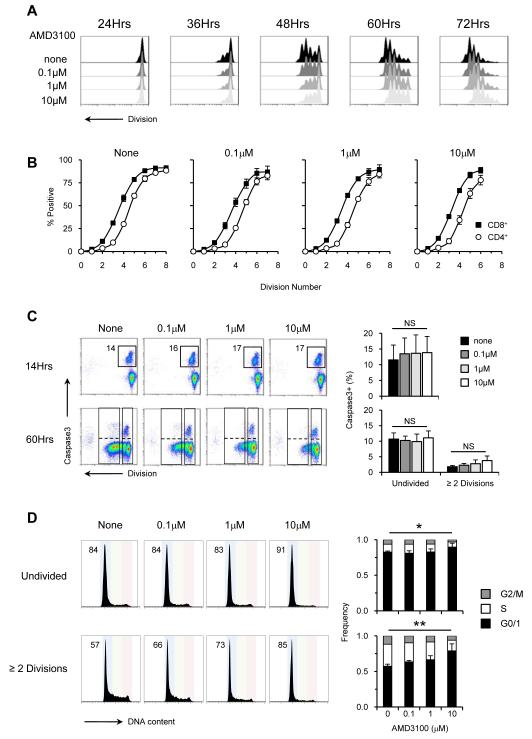
 , 1μM
, 1μM  and 10μM (□). (D) DNA content profiles from cells cultured for 60hrs. The gating strategy used to identify divided and undivided populations is the same as in Figure 3D. Graphs show data from three independent experiments where G0/1 = ■, S = □ and G2/M =
  . For all statistical analysis a repeated measures ANOVA test was performed. NS = not significant, * = p<0.05.
References
-
- Yamasaki S, Saito T. Molecular basis for pre-TCR-mediated autonomous signaling. Trends in Immunology. 2007;28:39–43. - PubMed
-
- Taghon T, Yui MA, Pant R, Diamond RA, Rothenberg EV. Developmental and molecular characterization of emerging beta- and gammadelta-selected pre-T cells in the adult mouse thymus. Immunity. 2006;24:53–64. - PubMed
-
- Ciofani M, Zuniga-Pflucker JC. Notch promotes survival of pre-T cells at the beta-selection checkpoint by regulating cellular metabolism. Nat Immunol. 2005;6:881–888. - PubMed
Publication types
MeSH terms
Substances
Grants and funding
- BBS/E/B/0000L230/BB_/Biotechnology and Biological Sciences Research Council/United Kingdom
- BBS/E/B/0000C206/BB_/Biotechnology and Biological Sciences Research Council/United Kingdom
- BB/F02066X/1/BB_/Biotechnology and Biological Sciences Research Council/United Kingdom
- MRC_/Medical Research Council/United Kingdom
- BBS/E/B/0000M206/BB_/Biotechnology and Biological Sciences Research Council/United Kingdom
LinkOut - more resources
Full Text Sources
Molecular Biology Databases
