Understanding the kinetic roles of the inducer heparin and of rod-like protofibrils during amyloid fibril formation by Tau protein
- PMID: 21931162
- PMCID: PMC3234720
- DOI: 10.1074/jbc.M111.271874
Understanding the kinetic roles of the inducer heparin and of rod-like protofibrils during amyloid fibril formation by Tau protein
Abstract
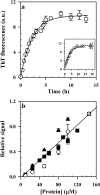
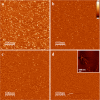
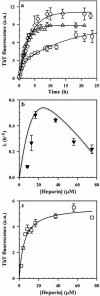
The aggregation of the natively disordered protein, Tau, to form lesions called neurofibrillary tangles is a characteristic feature of several neurodegenerative tauopathies. The polyanion, heparin, is commonly used as an inducer in studies of Tau aggregation in vitro, but there is surprisingly no comprehensive model describing, quantitatively, all aspects of the heparin-induced aggregation reaction. In this study, rate constants and extents of fibril formation by the four repeat domain of Tau (Tau4RD) have been reproducibly determined over a full range of heparin and protein concentrations. The kinetic role of heparin in the nucleation-dependent fibril formation reaction is shown to be limited to participation in the initial rate-limiting steps; a single heparin molecule binds two Tau4RD molecules, forming an aggregation-competent protein dimer, which then serves as a building block for further fibril growth. Importantly, the minimal kinetic model that is proposed can quantitatively account for the characteristic bell-shaped dependence of the aggregation kinetics on the stoichiometry of protein to heparin. Very importantly, this study also identifies for the first time short and thin, rod-like protofibrils that are populated transiently, early during the time course of fibril formation. The identification of these protofibrils as bona fide off-pathway species has implications for the development of therapies for tauopathies based on driving fibril formation as a means of protecting the cell from smaller, putatively toxic aggregates.
Figures


Similar articles
-
Resonance Raman spectroscopic measurements delineate the structural changes that occur during tau fibril formation.Biochemistry. 2014 Oct 21;53(41):6550-65. doi: 10.1021/bi500528x. Epub 2014 Oct 6. Biochemistry. 2014. PMID: 25284680
-
Appraisal of role of the polyanionic inducer length on amyloid formation by 412-residue 1N4R Tau protein: A comparative study.Arch Biochem Biophys. 2016 Nov 1;609:1-19. doi: 10.1016/j.abb.2016.09.004. Epub 2016 Sep 13. Arch Biochem Biophys. 2016. PMID: 27638048
-
Evidence for the existence of a secondary pathway for fibril growth during the aggregation of tau.J Mol Biol. 2012 Aug 10;421(2-3):296-314. doi: 10.1016/j.jmb.2012.01.007. Epub 2012 Jan 17. J Mol Biol. 2012. PMID: 22281439
-
Mechanistic studies unravel the complexity inherent in tau aggregation leading to Alzheimer's disease and the tauopathies.Biochemistry. 2013 Jun 18;52(24):4107-26. doi: 10.1021/bi400209z. Epub 2013 Jun 6. Biochemistry. 2013. PMID: 23721410 Review.
-
Amyloidogenesis of Tau protein.Protein Sci. 2017 Nov;26(11):2126-2150. doi: 10.1002/pro.3275. Epub 2017 Sep 13. Protein Sci. 2017. PMID: 28833749 Free PMC article. Review.
Cited by
-
The Role of Post-Translational Modifications on the Structure and Function of Tau Protein.J Mol Neurosci. 2022 Aug;72(8):1557-1571. doi: 10.1007/s12031-022-02002-0. Epub 2022 Mar 24. J Mol Neurosci. 2022. PMID: 35325356 Review.
-
Solid-state NMR investigation of the involvement of the P2 region in tau amyloid fibrils.Sci Rep. 2020 Dec 3;10(1):21210. doi: 10.1038/s41598-020-78161-0. Sci Rep. 2020. PMID: 33273615 Free PMC article.
-
Conformational features of tau fibrils from Alzheimer's disease brain are faithfully propagated by unmodified recombinant protein.Biochemistry. 2013 Oct 8;52(40):6960-7. doi: 10.1021/bi400866w. Epub 2013 Sep 27. Biochemistry. 2013. PMID: 24033133 Free PMC article.
-
Liquid-liquid phase separation of tau: From molecular biophysics to physiology and disease.Protein Sci. 2021 Jul;30(7):1294-1314. doi: 10.1002/pro.4093. Epub 2021 May 14. Protein Sci. 2021. PMID: 33930220 Free PMC article. Review.
-
The Structure Biology of Tau and Clue for Aggregation Inhibitor Design.Protein J. 2021 Oct;40(5):656-668. doi: 10.1007/s10930-021-10017-6. Epub 2021 Aug 17. Protein J. 2021. PMID: 34401998 Review.
References
-
- Goedert M., Spillantini M. G., Jakes R., Rutherford D., Crowther R. A. (1989) Neuron 3, 519–526 - PubMed
-
- Lee G., Cowan N., Kirschner M. (1988) Science 239, 285–288 - PubMed
-
- Gustke N., Trinczek B., Biernat J., Mandelkow E. M., Mandelkow E. (1994) Biochemistry 33, 9511–9522 - PubMed
-
- Schweers O., Schönbrunn-Hanebeck E., Marx A., Mandelkow E. (1994) J. Biol. Chem. 269, 24290–24297 - PubMed
Publication types
MeSH terms
Substances
LinkOut - more resources
Full Text Sources
Other Literature Sources
Medical

