. 2011 Sep;9(9):e1001151.
doi: 10.1371/journal.pbio.1001151. Epub 2011 Sep 13.

Natural killer cell lytic granule secretion occurs through a pervasive actin network at the immune synapse

Affiliations

Natural killer cell lytic granule secretion occurs through a pervasive actin network at the immune synapse

Gregory D Rak et al. PLoS Biol. 2011 Sep.

Abstract

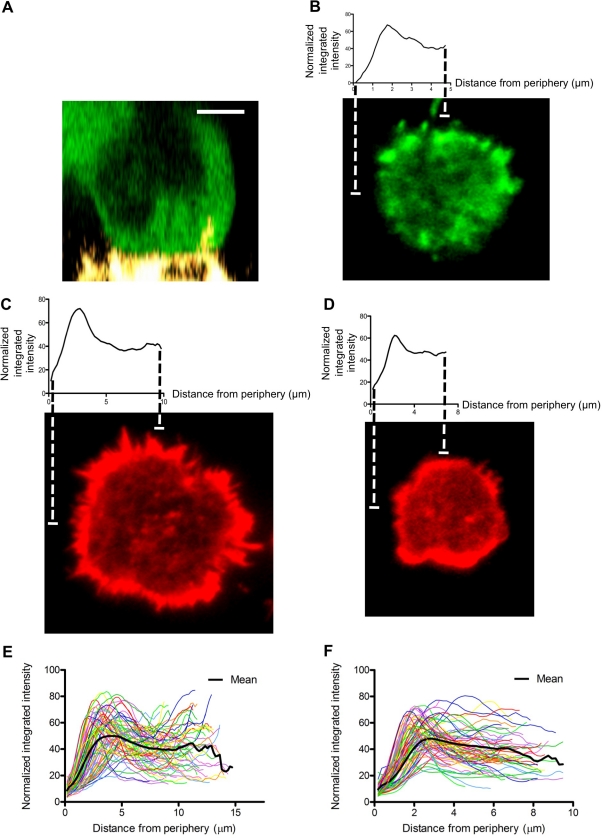
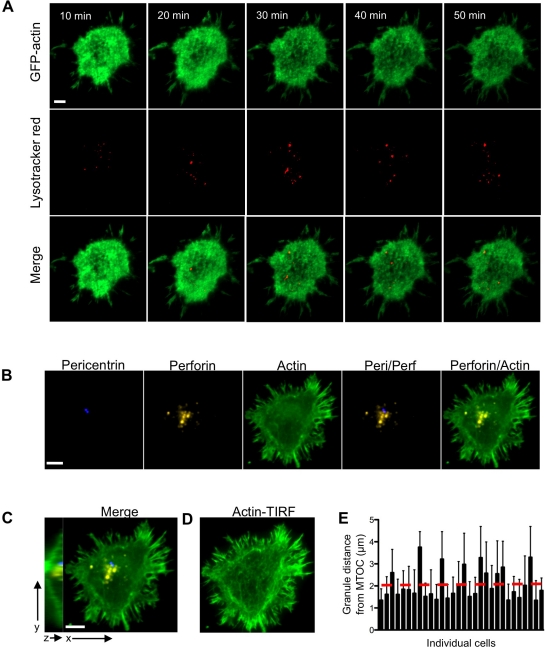
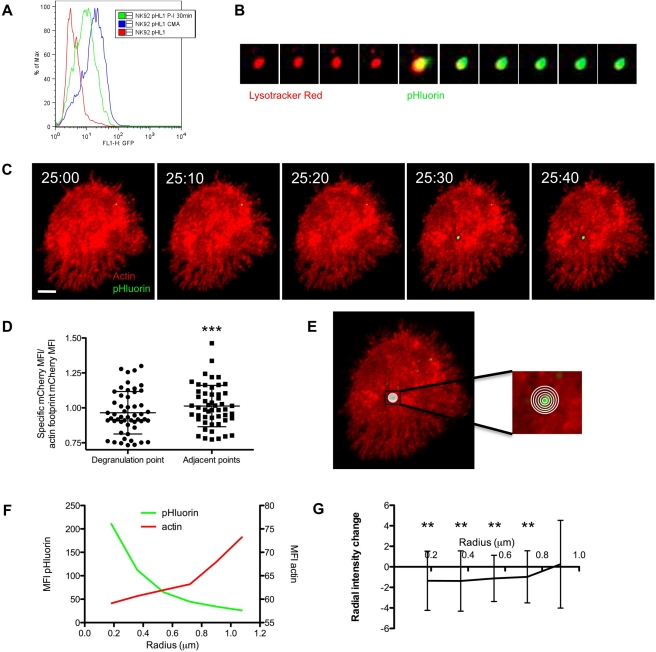
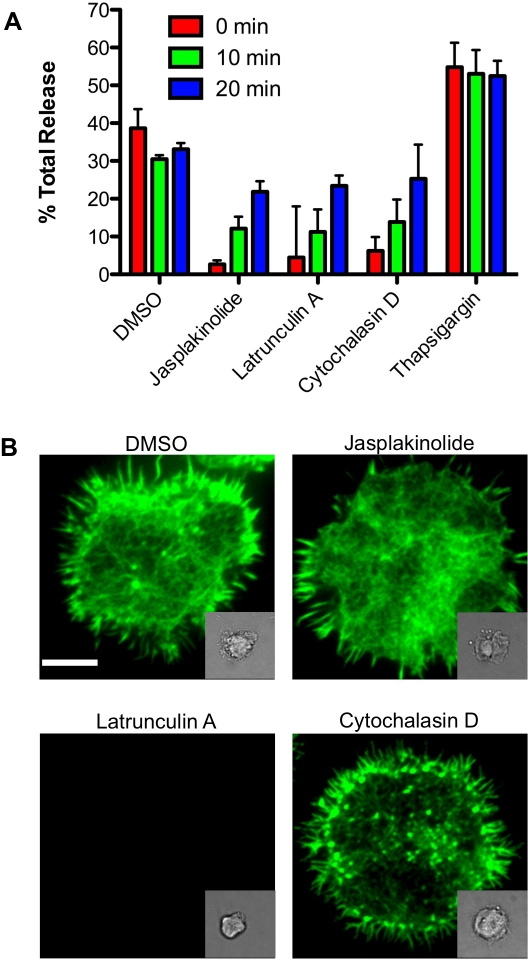
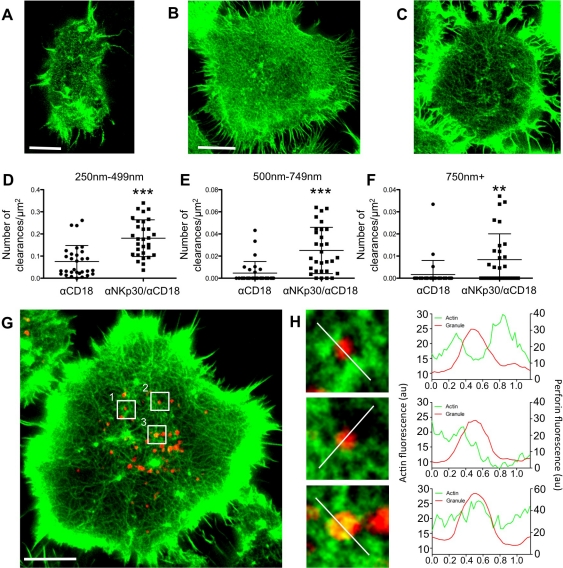
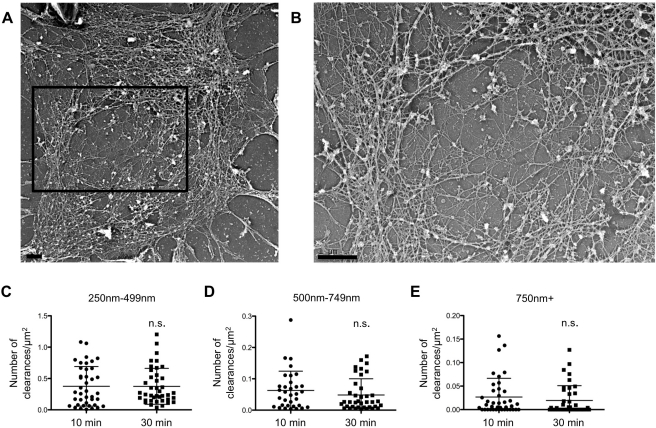
Accumulation of filamentous actin (F-actin) at the immunological synapse (IS) is a prerequisite for the cytotoxic function of natural killer (NK) cells. Subsequent to reorganization of the actin network, lytic granules polarize to the IS where their contents are secreted directly toward a target cell, providing critical access to host defense. There has been limited investigation into the relationship between the actin network and degranulation. Thus, we have evaluated the actin network and secretion using microscopy techniques that provide unprecedented resolution and/or functional insight. We show that the actin network extends throughout the IS and that degranulation occurs in areas where there is actin, albeit in sub-micron relatively hypodense regions. Therefore we propose that granules reach the plasma membrane in clearances in the network that are appropriately sized to minimally accommodate a granule and allow it to interact with the filaments. Our data support a model whereby lytic granules and the actin network are intimately associated during the secretion process and broadly suggest a mechanism for the secretion of large organelles in the context of a cortical actin barrier.


Conflict of interest statement

The authors have declared that no competing interests exist.

Figures

Figure 1
Figure 1. Actin distribution at the activated NK cell IS.
(A) 3-D projection of NK-92 GFP-actin expressing cell (green) conjugated to mel1190 target cell (yellow). Scale bar = 5 m. (B) X–Y projection of a synapse taken from a conjugate similar to (A). (C,D) X–Y projections of a representative NK-92 (left) or ex vivo (right) cell that had been activated for 30 min at 37°C on immobilized antibody to NKp30 and CD18, fixed, stained with 568 phalloidin (red), and imaged by TIRF microscopy. Above each X–Y projection is a plot of the mean fluorescent intensity (MFI) of concentric circles at a given distance beginning at the periphery of the cell and moving inward to the center (radial intensity profiles). (E,F) Plot of radial intensity profiles from 70 cells from 3 experiments for each cell type. Mean value is shown in black.
Figure 2
Figure 2. Granule approach to the synaptic membrane is coincident with the MTOC and actin network.
(A) NK-92 cells expressing GFP-actin (green) were loaded with LysoTracker Red (red) and activated by immobilized antibody to NKp30 and CD18. Cells were imaged at 1 frame per minute for 60 min using TIRFm. Images are shown at 10 min intervals starting at 10 min following contact. Images for the GFP channel (top), LysoTracker Red channel (middle), and a merge of both (bottom) are shown. (B–E) NK-92 cells were activated on glass, fixed, stained, and imaged by both confocal and TIRF microscopy using a 100× objective. (B) Images show pericentrin (blue), perforin (yellow), actin (green), and indicated merges at the plane of contact with the glass. (C) Full merge from (B) is shown to the right of a Y–Z projection of the cell. (D) TIRFm image of the cell from (B, C). (E) Distances of granules to the MTOC were measured and averaged on a per cell basis for 30 cells over 2 experiments. The red dashed line denotes the mean of all cells. Scale bars = 5 µm.
Figure 3
Figure 3. pHluorin-LAMP1 reports degranulation in locally hypodense regions of actin.
(A) Histogram demonstrating green fluorescence measured by flow cytometry of NK-92 cells expressing pHluorin-LAMP1. Cells were untreated or treated with PMA/Ionomycin or CMA. (B) NK-92 cells expressing pHluorin-LAMP1 (green) were loaded with LysoTracker Red (red) and imaged by TIRF under activating conditions. Frames were acquired at a rate of 2 frames per min following 10 min of activation and the image sequence depicts a cropped section showing a single lytic granule over time. (C) NK-92 cells expressing pHluorin-LAMP1 and mCherry-actin were activated by immobilized antibody to NKp30 and CD18 and imaged by TIRFm. Images shown were taken at 10-s intervals at indicated time of activation. Scale bar = 5 µm. (D) Ratio measurements of the MFI of mCherry-actin at the site of degranulation, or adjacent points, to the MFI of the whole cell footprint were calculated and represent 52 events; means = 0.965 and 1.013, respectively. (*** p = 0.0001, paired t test). (E) Image from (A) overlaid with concentric circles starting from the centroid of a degranulation event demonstrates measurement strategy for regional actin fluorescence intensity. (F) Radial intensity profiles of pHluorin and mCherry MFI are depicted and show the signal intensity changes as circles are moved radially outward from the centroid of degranulation event (left to right). (G) Radial intensity change of sequential circles moving outward from the centroid. Data represent 52 degranulation events (error bars, ± SD). Values are statistically significantly (** p<0.01, one sample t test) different to a value of 0.0, which would represent no change between sequential circles.
Figure 4
Figure 4. Inhibiting actin dynamics after activation interferes with degranulation.
NK-92 cells were activated by immobilized antibody to NKp30 and CD18 and incubated at 37°C. (A) Indicated inhibitors were added to samples at 0 min, 10 min, or 20 min following activation. Supernatants were harvested after 60 min of total incubation and assayed for Granzyme A activity. All values are statistically significantly different from respective DMSO controls (range: p<0.001–0.05, unpaired t test) and represent the mean of three experiments (error bars = SD). (B) Activated cells were treated with DMSO or indicated inhibitor, fixed, stained for F-actin with phalloidin, and imaged by TIRFm using a 100× objective. Representative images from the 10 min timepoint are shown with respective DIC images (inset). Scale bar = 5 µm.
Figure 5
Figure 5. STED microscopy of the NK cell IS demonstrates activation-induced changes in the actin network and reveals varying granule locations relative to actin at the IS.
(A) The synapse between a Citrine-actin expressing NK-92 and mel1190 target was imaged in the X–Y plane. (B, C) NK-92 cells were stimulated for 30 min on glass coated with either antibody to CD18 (B) or to both CD18 and NKp30 (C) and stained for F-actin with phalloidin. (D–F) Measurements of the number of clearances at the synapses of 30 cells from 2 experiments activated as in (B,C). (*** p<0.001; ** p = 0.0076; unpaired t test). Measurements were grouped into clearance diameters of 250–499 nm (D), 500–750 nm (E), and 750+ nm (F). (G) Activated NK-92 cell stained for F-actin (green) and perforin (red) and imaged via STED microscopy in the green channel and confocal microscopy in the red channel. (H) Magnified images are from boxes in (G): box 1 (top), box 2 (middle), and box 3 (bottom). To the right of each image is a line profile indicating pixel intensities of actin (green) and perforin (red) for the line bisecting the granules as indicated by the white line. Scale bars = 5 µm.
Figure 6
Figure 6. Platinum replica electron microscopy of the synapse further supports a network of actin filaments with lytic granule-sized clearances.
NK-92 cells activated by immobilized antibodies to NKp30 and CD18 for 10 min or 30 min and then sheared apart by sonication were viewed by platinum replica electron microscopy. (A) Activated cortical synapse at 30 min of activation. (B) Enlargement of central boxed region in (A). Scale bars = 1 µm. (C–E) Measurements and comparison of the number of clearances of specified sizes: 250–499 nm (C), 500–749 nm (D), and greater than 750 nm (E).
Figure 7
Figure 7. Approximation of lytic granule-sized organelles with and within cortical actin networks.
(A,B) 20,000× images taken using platinum replica electron microscopy following activation of NK-92 cells by immobilized antibody to NKp30 and CD18 and then “unroofing” with nitrocellulose membrane (top) (scale bar = 1 µm). Pseudocolored images are shown (bottom) highlighting filaments (blue), granules (yellow), and plasma membrane (green). (C) Traditional (left) and proposed (right) model of granule delivery through the immunologic synapse.

References

    1. Vivier E, Tomasello E, Baratin M, Walzer T, Ugolini S. Functions of natural killer cells. Nat Immunol. 2008;9:503–510. - PubMed
    1. Lanier L. L. NK cell recognition. Annu Rev Immunol. 2005;23:225–274. - PubMed
    1. Wulfing C, Purtic B, Klem J, Schatzle J. D. Stepwise cytoskeletal polarization as a series of checkpoints in innate but not adaptive cytolytic killing. Proc Natl Acad Sci U S A. 2003;100:7767–7772. - PMC - PubMed
    1. Orange J. S. Formation and function of the lytic NK-cell immunological synapse. Nat Rev Immunol. 2008;8:713–725. - PMC - PubMed
    1. Orange J. S, Harris K. E, Andzelm M. M, Valter M. M, Geha R. S, et al. The mature activating natural killer cell immunologic synapse is formed in distinct stages. Proc Natl Acad Sci U S A. 2003;100:14151–14156. - PMC - PubMed

Publication types

MeSH terms

Substances