. 2011 Sep;7(9):e1002149.
doi: 10.1371/journal.pcbi.1002149. Epub 2011 Sep 8.

Efficacy of synaptic inhibition depends on multiple, dynamically interacting mechanisms implicated in chloride homeostasis

Affiliations

Efficacy of synaptic inhibition depends on multiple, dynamically interacting mechanisms implicated in chloride homeostasis

Nicolas Doyon et al. PLoS Comput Biol. 2011 Sep.

Abstract

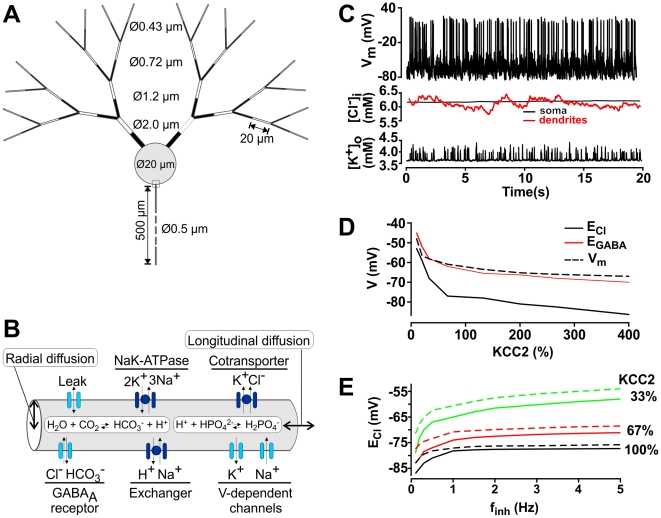
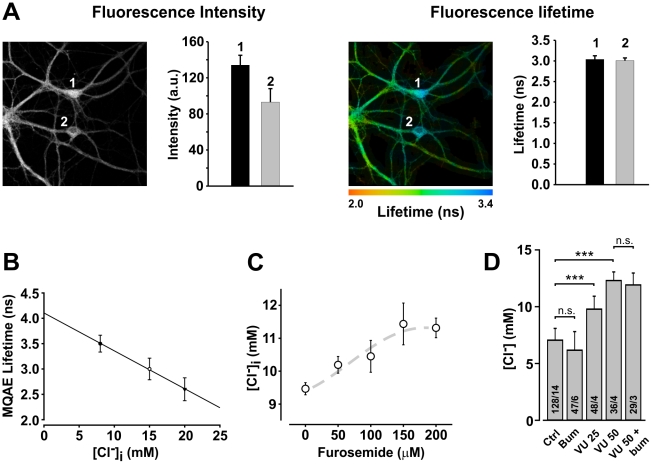
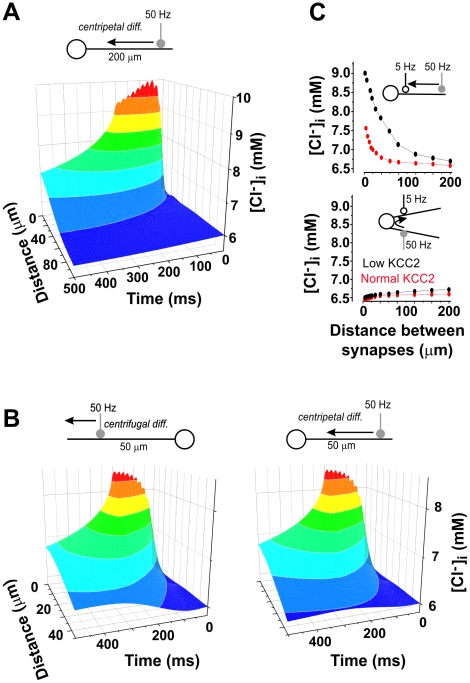
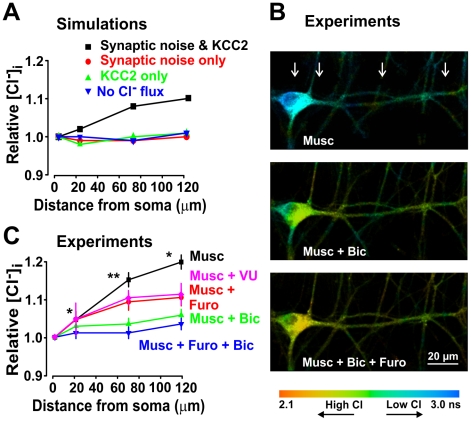
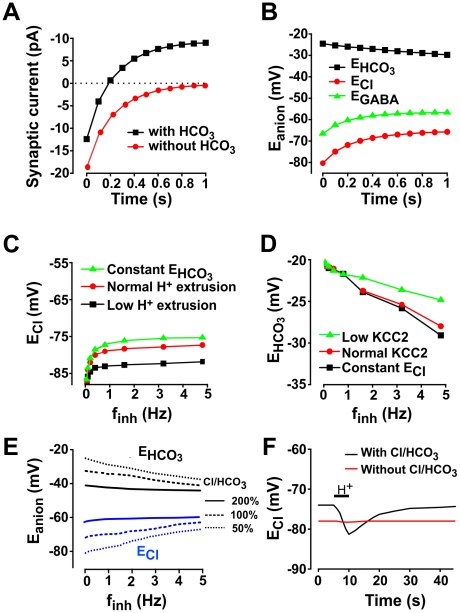
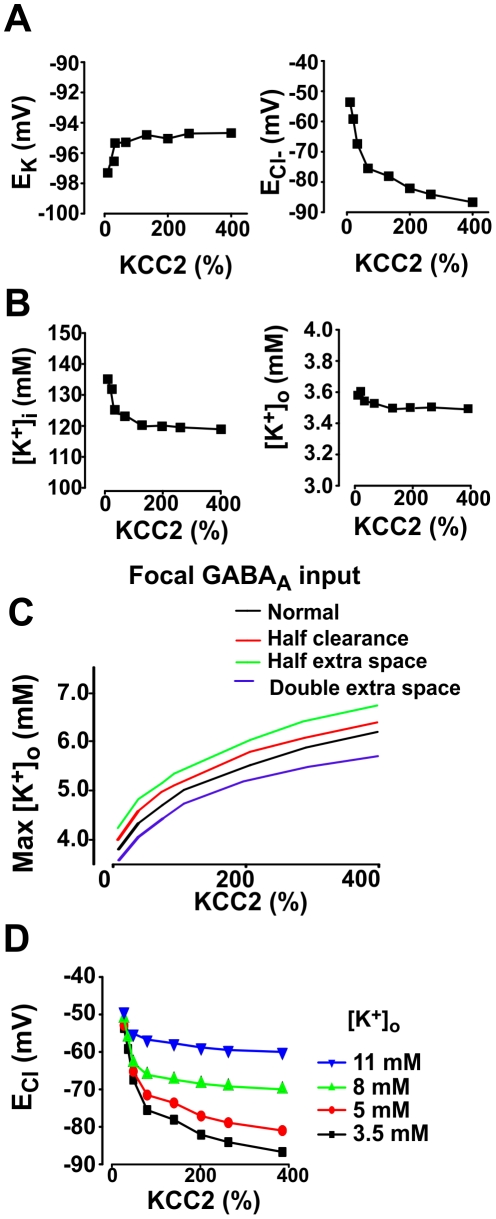
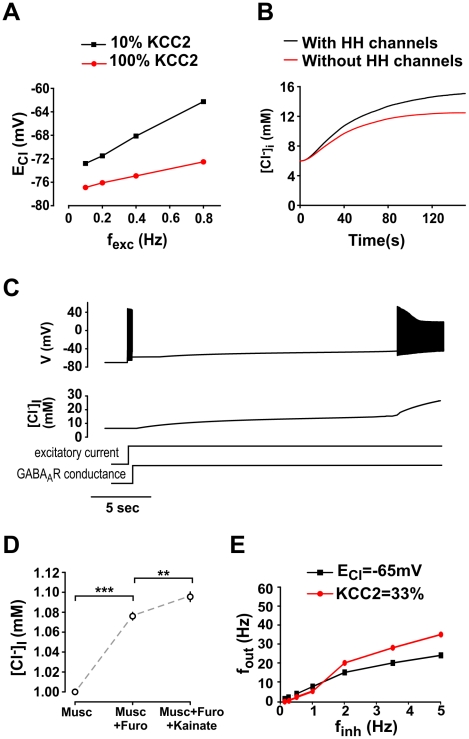
Chloride homeostasis is a critical determinant of the strength and robustness of inhibition mediated by GABA(A) receptors (GABA(A)Rs). The impact of changes in steady state Cl(-) gradient is relatively straightforward to understand, but how dynamic interplay between Cl(-) influx, diffusion, extrusion and interaction with other ion species affects synaptic signaling remains uncertain. Here we used electrodiffusion modeling to investigate the nonlinear interactions between these processes. Results demonstrate that diffusion is crucial for redistributing intracellular Cl(-) load on a fast time scale, whereas Cl(-)extrusion controls steady state levels. Interaction between diffusion and extrusion can result in a somato-dendritic Cl(-) gradient even when KCC2 is distributed uniformly across the cell. Reducing KCC2 activity led to decreased efficacy of GABA(A)R-mediated inhibition, but increasing GABA(A)R input failed to fully compensate for this form of disinhibition because of activity-dependent accumulation of Cl(-). Furthermore, if spiking persisted despite the presence of GABA(A)R input, Cl(-) accumulation became accelerated because of the large Cl(-) driving force that occurs during spikes. The resulting positive feedback loop caused catastrophic failure of inhibition. Simulations also revealed other feedback loops, such as competition between Cl(-) and pH regulation. Several model predictions were tested and confirmed by [Cl(-)](i) imaging experiments. Our study has thus uncovered how Cl(-) regulation depends on a multiplicity of dynamically interacting mechanisms. Furthermore, the model revealed that enhancing KCC2 activity beyond normal levels did not negatively impact firing frequency or cause overt extracellular K(-) accumulation, demonstrating that enhancing KCC2 activity is a valid strategy for therapeutic intervention.


Conflict of interest statement

The authors have declared that no competing interests exist.

Figures

Figure 1
Figure 1. Summary and initial validation of model.
A. Schematic of model neuron showing geometry and compartment dimensions. B. Summary of ion flux mechanisms included in the model (see Methods for details). Diffusion in the extracellular space is not depicted. C. Sample traces of membrane potential together with [K+]o measured in the extracellular shell surrounding the soma and [Cl]i measured in the soma (black) and in a dendrite (red). This is only a subset of ion species whose concentrations were continuously monitored in all compartments, and from which reversal potentials were continuously updated. D. As predicted, reducing KCC2 below its “normal” level (100%) caused large depolarizing shifts in E Cl and E GABA, whereas increasing KCC2 up to 400% above normal caused only minor hyperpolarizing shifts. Simulation includes background synaptic input with f inh  =  0.8 Hz and f exc  =  0.2 Hz/synapse. The dashed line represents the mean value of membrane potential averaged over 200 s. E. Reversal potentials also depended on the rate of GABAAR input, which dictates the Cl load experienced by the neuron. Increasing f inh caused a depolarizing shift in E Cl, the extent of which increased when KCC2 was decreased. For these simulations, f inh/f exc ratio was fixed at 4 and f inh was varied from 0.05 Hz to 4.8 Hz. Dashed lines represent results from simulations performed with tonic GABAA conductances while solid lines represent simulations performed without it.
Figure 2
Figure 2. Measurements of [Cl]i in neurons with MQAE using Fluorescence Lifetime Imaging Microscopy (FLIM).
A. Two-photon excitation fluorescence of MQAE-loaded hippocampal neurons (26 DIV). The mean intensity of MQAE fluorescence within the cell bodies 1 & 2 was significantly different (left), which could be interpreted as indicating different levels of [Cl]i or different dye uptake and accumulation between the two cells. The lifetime maps of the same cells are shown in the micrograph on the right. Note how, in contrast to intensities, the fluorescence lifetime of both cells were not significantly different indicating that there were no difference in [Cl]i between the two cells. Values are mean ± S.D. of all pixels in each cell body. B. Measurements of MQAE lifetime at different [Cl]i inside the cell body after membrane permeabilization and equilibration with [Cl]o at 8, 15 or 20 mM (N  =  73 cells/12 coverslips). According to the Stern-Volmer equation: τ0/τ  =  1 + Ksv[Cl]. The measured Ksv from these data was 32 M−1, consistent with previous reports . C. Effect of increasing concentration of furosemide (to block KCC2) on [Cl]i in cultured neurons exposed to 100 µM muscimol (to evoke a constant Cl load by opening GABAAR; N  =  75 cells/10 coverslips). D. The selective KCC2 antagonist VU 0240551 caused a dose-dependent significant increase in [Cl]i (p<0.05), but bumetamide had no significant (n.s.) effect alone or after blocking KCC2 with VU 0240551, indicating lack of significant NKCC1 transport in these cells (N indicated in each bar  =  cells/coverslips; ***, p < 0.001).
Figure 3
Figure 3. Redistribution of intracellular Cl through electrodiffusion.
A. Chloride influx through a single GABAAR synapse (located at 200 µm from the soma) activated at 50 Hz produced a substantial longitudinal gradient in [Cl]i extending 60 µm on each side of the input. B. Chloride influx through a single GABAAR synapse (this time located at 50 µm from the soma) produced a longitudinal gradient which is steeper toward the soma (centripetal diffusion) than away from the soma (centrifugal diffusion). For this simulation, we used dendrites with constant diameters to ensure that the difference between left and right panels is due to the sink effect of the soma and not to the conical shape of the dendrite. We also lengthened the dendrite and increased the number of compartments to 60 compared to the cell geometry summarized in Fig. 1. C. Spread of Cl entering through one synapse (activated at 50 Hz) to a second “test” synapse (activated at 5 Hz) at varying inter-synapses distances was measured for normal and low (10%) KCC2 levels. Both synapses were activated simultaneously. For synapses positioned on the same primary dendrites (upper panel), the test synapse experienced a sizeable increase in [Cl]i, especially when KCC2 was reduced, but there was no appreciable spread of Cl between synapses located on different primary dendrites (lower panel).
Figure 4
Figure 4. A standing somato-dendritic Cl gradient is caused by the joint action of KCC2 activity and GABAAR mediated synaptic input.
A. Distribution of [Cl]i in a modeled dendrite as a function of distance from the soma in the presence and absence of Cl load due to distributed synaptic activity and of Cl extrusion through uniformly distributed KCC2. B. Photomicrographs of an example cell loaded with MQAE with lifetime color coding (blue: low Cl concentration, red: high Cl concentration). Intracellular Cl concentration was measured in the presence of muscimol (Musc; 100 µM) and/or bicuculline (Bic; 100 µM) and/or furosemide (Furo; 200 µM) and/or VU 0240551 (VU, 15 µM). Arrows indicate the location where measurements were performed. C. Effect of tonic activation of GABAARs by muscimol on [Cl]i in real dendrites as a function of distance from the soma (each data point represent mean ± SEM taken from 10–12 neurons; values from several dendrites were averaged for each cell). Bicuculline and/or furosemide and/or VU 0240551 were added to block Cl loading and extrusion, respectively.
Figure 5
Figure 5. The density of KCC2 is constant along dendrites of neurons in culture.
A. Three confocal images tiled showing a neuron immunostained with a fluorescent anti-KCC2 antibody Images are of size 1024×1024pixels with a pixel size of 0.115 µm and a 9.1 µs pixel dwell time. Three red squares representing example regions analyzed are shown, in B, with their corresponding binary mask used to delineate the labeled dendrite. The intensity histograms of the representative subregions delimited in A are shown in B with their corresponding SpIDA fit and recovered values of monomer (N1) and dimer (N2) densities. The distance (e.g., d in A) between the center of the cell body and the center of the analyzed region was also measured. C. Graph of the density of KCC2 dimers at the dendrite surface as a function of the distance from the cell body obtained with SpIDA. 823 regions were analyzed from 27 neurons. Error bars show SEM.
Figure 6
Figure 6. Inhomogenous CCC distribution can create large-scale, but not fine-scale, intracellular [Cl]i gradients.
A. left: To investigate whether the perisynaptic distribution of KCC2 can produce fine-scale intracellular [Cl]i gradients, we varied the subcompartmental distribution of KCC2 by concentrating it in a single location in each compartment at varying distances from a bursting synapse. We divided the compartment into 20 1-µm-long sections. Total amount of KCC2 per compartment was constant at 100%. Inhibitory synapses were located at 20 µm from each other and were activated at high frequency. Right: Results show that the subcompartmental distribution has little impact on the perisynaptic value of E Cl, which contrasts with the impact of high frequency synaptic input (see Fig. 3) but is consistent with diffusion being responsible for rapid redistribution of intracellular Cl load. B. In the absence of synaptic activity, we inserted different levels of NKCC1 activity in the axon initial segment (AIS) and monitored the axo-somato-dentritic [Cl]i gradient for high (100%) and low (33%) levels of KCC2 activity (uniformly distributed, except in the AIS). Soma corresponds to 0 on x-axis; positive distance extends towards dendrites and negative distance extends towards axon, as summarized on left panel. C. In the presence of background synaptic activity (f inh  =  0.4 Hz; f exc  =  0.1 Hz) we simulated different levels of KCC2 activity (uniformly distributed, except in the AIS) and monitored the axo-somato-dentritic [Cl]i gradient in the presence (100%) or absence of NKCC1 in the AIS.
Figure 7
Figure 7. Dependency of Cl accumulation on the site of synaptic input and KCC2 level.
Trains (40 Hz) of inhibitory postsynaptic currents (IPSCs) at a synapse located at one of four positions: soma and proximal, middle, and distal dendrites (40, 100, and 240 µm from soma, respectively) in simulations without (A) and with (B) background synaptic input (f inh  =  0.4 Hz, f exc  =  0.1 Hz). For this set of simulations, a single dendrite was lengthened (and number of compartments increased to 60) relative to the cell geometry summarized in Fig. 1A. Inversion of the IPSC was evident in the distal dendrites under conditions without KCC2 (right panels). C. Mean intraburst IPSC became smaller (i.e. less hyperpolarizing) with increasing distance from the soma and with decreasing KCC2 level. Synaptic background activity was the same as in B. Mean IPSC was measured at a “test” synapse activated at 40 Hz for 200 ms every second over 50 s of simulated time. Steady state value of E Cl (D) and rate at which E Cl approaches steady state (E) for different KCC2 levels and distances of “test” synapse from the soma. Steady state E Cl reported in D was measured as the value to which E Cl converged when GABAAR at the test synapse were artificially held open. This convergence was fit with a single exponential to determine the time constant reported in E.
Figure 8
Figure 8. Efficacy of inhibition depends on spatial and temporal features of GABAAR input.
A. Schematic shows synapse positioning (left panel). GABAAR input clustered at a single synapse (red) produced less outward current than the same total input distributed across ten spatially separated synapses (green), especially for input to the distal dendrites (center panel). To ensure that “total charge” translates into functionally relevant inhibition (i.e. reduction in spiking), we submitted the model to distributed excitatory input (f exc  =  0.2 Hz) and measured firing rate. As expected, reduction in firing frequency was greater when inhibitory input was spatially distributed (right panel). B. Net charge carried through a “test” synapse (color) consistently decreased as KCC2 activity was reduced, but increasing the frequency (left panel), time constant (middle panel) or conductance (right panel) of input at that synapse did not necessarily increase current amplitude. For the left panel, the time constant was held at 10 ms while the input frequency and KCC2 level were varied; the dotted line shows optimal frequency, which is re-plotted in D. For the middle panel, the input frequency was held at 30 Hz while the time constant and KCC2 level were varied. For the right panel input frequency and time constant were held at 30 Hz and 10 ms respectively while the conductance and KCC2 level were varied. Background synaptic activity was included in these simulations (f inh  =  0.4 Hz, f exc  =  0.1 Hz). Test synapse was positioned at 50 µm from the soma. C. We performed simulations similar to that in B but added distributed excitatory input to assess inhibition on the basis of firing rate reduction rather than on the basis of total charge (left panel). The pattern of inverted bell-shaped curves is consistent with B, thus confirming a net change in inhibition at the whole cell level. The graph on the right illustrates results obtained from simulations with models including Ca2+-activated K+ channels or persistent Na+ channels. We also concentrated dendritic HH channels at branch points while preserving the total conductance of these channels. Results were qualitatively the same as in the graph on the left. D. Optimal input frequency depending on KCC2 level and time constant (left panel) and the corresponding current (right panel). Black curves correspond to dotted line on left panel of B. Note that this is the optimal frequency for activation of a single “test” synapse; optimal input frequency would necessarily decrease as the number of activated synapses increased, although the exact relationship would depend on the spatial distribution of those active synapses (see A) as well as the level of background synaptic activity.
Figure 9
Figure 9. Trade-off between robustness of HCO3 and Cl homeostasis.
A. Change in synaptic current over time as GABAAR synapse is held open. Notice in the standard model (black) that current eventually inverted; in contrast, current decayed to zero but did not invert in the model without HCO3 efflux (red). B. Change in reversal potentials over time for standard model and same test conditions as in A. Although small compared to changes in E Cl, E HCO3 did shift (in the opposite direction). The balance of those changes determines the net shift in E GABA, which explains the functional implications of predictions tested in C and D – a reduced change in E HCO3 should produce an enhanced change in E Cl, whereas a reduced change in E Cl should produce an enhanced change in E HCO3. C. Encouraging HCO3 efflux through GABAAR by holding [HCO3 ] constant (green) exacerbated the depolarizing shift in E Cl. Discouraging HCO3 efflux by reducing H+ extrusion to 33% of normal (black), which in turn discourages the forward reaction catalyzed by carbonic anhydrase and accelerates depletion of intracellular HCO3 , mitigated the depolarizing shift in E Cl. D. Conversely, encouraging Cl influx through GABAAR by holding [Cl] constant (black) exacerbated the hyperpolarizing shift in E HCO3. Discouraging Cl influx by reducing KCC2 activity to 10% of normal (green) mitigated the hyperpolarizing shift in E HCO3. Effects in C were stronger than those in D, which illustrates how inter-relationships can be asymmetrical, i.e. pH regulation has a stronger impact on [Cl] dynamics than Cl regulation has on pH dynamics under the conditions simulated here. E. Simulations similar to the ones conducted in C and D were performed but with the addition of Cl/HCO3 exchanger at different levels of activity. F. We performed a simulation in which we added an artificial H+ influx for 5 s (horizontal bar). The proton influx caused a sizeable drop in [HCO3 ]i, thereby producing a hyperpolarizing shift in E HCO3; that shift is greater in the model without the Cl/HCO3 exchanger (not shown). The resulting change in HCO3 gradient caused an inversion of Cl/HCO3 exchange that led to a significant lowering of E Cl; this did not occur in the absence of the Cl/HCO3 exchanger.
Figure 10
Figure 10. Interactions between [Cl] regulation and [K+] regulation.
A. Variation of KCC2 levels caused sizeable shifts in E Cl (right panel) but had negligible effects on E K (left panel). Background synaptic activity was f exc  =  0.2 Hz and f inh  =  0.8 Hz. B. Intra- and extracellular concentrations of K+ for same simulations reported in A. Although extracellular K+ levels are low, [K+]o remains relatively stable due to other mechanisms, e.g. extracellular diffusion. This explains why E K remains relatively constant in A. C. Maximal [K+]o reached by applying a 500 nS GABA conductance to a dendrite. Time constant for diffusion from the FH space was tested at 100 and 200 ms (which corresponds to normal and 50% slower extracellular K+ clearance) as well as with variable extracellular space. D. E Cl as a function of the mean frequency of inhibitory input for various fixed levels of [K+]o.
Figure 11
Figure 11. Effects of membrane potential on intracellular Cl accumulation.
A. Varying the rate of excitatory synaptic drive (f exc) caused a depolarizing shift in E Cl secondary to changes in average membrane potential. f inh was fixed at 0.4 Hz. B. Spiking exacerbates intracellular Cl accumulation as illustrated here by convergence of the model to different steady state [Cl]i depending on whether the model does or does not contain HH channels (i.e. does or does not spike, respectively). For this simulation, KCC2 activity was low (10%), f inh  =  0.8 Hz, and f exc  =  0.4 Hz. C. Sample traces showing inter-relationship between [Cl]i and spiking. Neuron began spiking when constant excitatory current was applied to the soma, but without any concomitant change in [Cl]i since there was not yet any GABAAR-mediated conductance. Turning on constant GABAAR conductance in the soma terminated spiking, but at the expense of intracellular Cl accumulation. Chloride slowly accumulated over the next several seconds until membrane potential reached spike threshold, at which point spiking resumed and Cl began a second phase of accelerated accumulation. D. To test whether Cl accumulation is exacerbated by excitatory synaptic input in real neurons, somatic Cl concentration was measured using FLIM in neurons with or without glutamatergic receptor activation by kainate. As predicted by simulations, Cl accumulation was greater in neurons exposed to kainate. Furosemide was applied to block KCC2 activity in these experiments (**, p < 0.001; ***, p < 0.0001). Data from 56 cells from 5 coverslips. E. Comparison of input-output curve for static (black) vs. dynamic (red) E Cl. Discrepancies between the curves clearly demonstrate that E Cl cannot be approximated as constant value when considering a range of input conditions.

Similar articles

Cited by

References

    1. Hausser M, Major G, Stuart GJ. Differential shunting of EPSPs by action potentials. Science. 2001;291:138–141. - PubMed
    1. Staley KJ, Soldo BL, Proctor WR. Ionic mechanisms of neuronal excitation by inhibitory GABAA receptors. Science. 1995;269:977–981. - PubMed
    1. Kaila K, Voipio J. Postsynaptic Fall in intracellular pH induced by GABA-activated bicarbonate Cconductance. Nature. 1987;330:163–165. - PubMed
    1. Staley KJ, Proctor WR. Modulation of mammalian dendritic GABAA receptor function by the kinetics of Cl− and HCO3 − transport. J Physiol. 1999;519:693–712. - PMC - PubMed
    1. Prescott SA, Sejnowski TJ, De Koninck Y. Reduction of anion reversal potential subverts the inhibitory control of firing rate in spinal lamina I neurons: towards a biophysical basis for neuropathic pain. Mol Pain. 2006;2:32. - PMC - PubMed

Publication types

MeSH terms