

A genome-wide metabolic QTL analysis in Europeans implicates two loci shaped by recent positive selection
- PMID: 21931564
- PMCID: PMC3169529
- DOI: 10.1371/journal.pgen.1002270
A genome-wide metabolic QTL analysis in Europeans implicates two loci shaped by recent positive selection
Abstract
We have performed a metabolite quantitative trait locus (mQTL) study of the (1)H nuclear magnetic resonance spectroscopy ((1)H NMR) metabolome in humans, building on recent targeted knowledge of genetic drivers of metabolic regulation. Urine and plasma samples were collected from two cohorts of individuals of European descent, with one cohort comprised of female twins donating samples longitudinally. Sample metabolite concentrations were quantified by (1)H NMR and tested for association with genome-wide single-nucleotide polymorphisms (SNPs). Four metabolites' concentrations exhibited significant, replicable association with SNP variation (8.6×10(-11)<p<2.8×10(-23)). Three of these-trimethylamine, 3-amino-isobutyrate, and an N-acetylated compound-were measured in urine. The other-dimethylamine-was measured in plasma. Trimethylamine and dimethylamine mapped to a single genetic region (hence we report a total of three implicated genomic regions). Two of the three hit regions lie within haplotype blocks (at 2p13.1 and 10q24.2) that carry the genetic signature of strong, recent, positive selection in European populations. Genes NAT8 and PYROXD2, both with relatively uncharacterized functional roles, are good candidates for mediating the corresponding mQTL associations. The study's longitudinal twin design allowed detailed variance-components analysis of the sources of population variation in metabolite levels. The mQTLs explained 40%-64% of biological population variation in the corresponding metabolites' concentrations. These effect sizes are stronger than those reported in a recent, targeted mQTL study of metabolites in serum using the targeted-metabolomics Biocrates platform. By re-analysing our plasma samples using the Biocrates platform, we replicated the mQTL findings of the previous study and discovered a previously uncharacterized yet substantial familial component of variation in metabolite levels in addition to the heritability contribution from the corresponding mQTL effects.
Conflict of interest statement
The authors have declared that no competing interests exist.
Figures
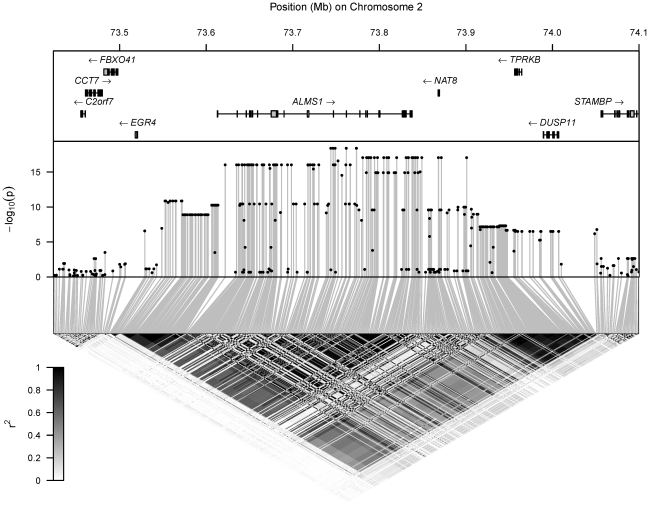
 ) for the test of association of the metabolite's concentration with each SNP in the region. Bottom: LD between each pair of SNPs in the region, with the colour scale for
  superimposed.
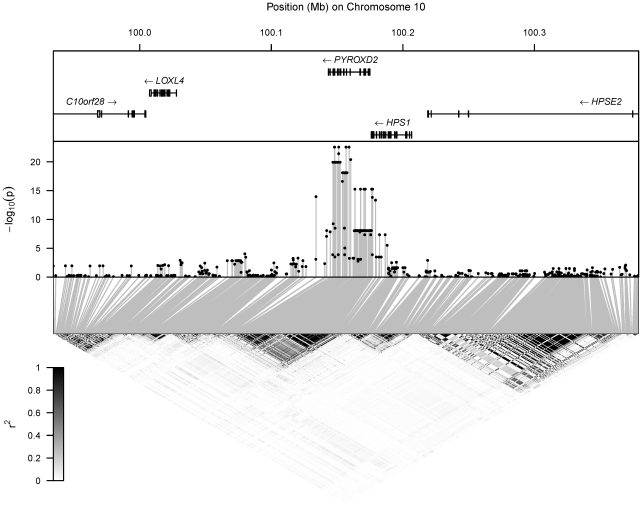
 ) for the test of association of the metabolite's concentration with each SNP in the region. Bottom: LD between each pair of SNPs in the region, with the colour scale for
  superimposed.
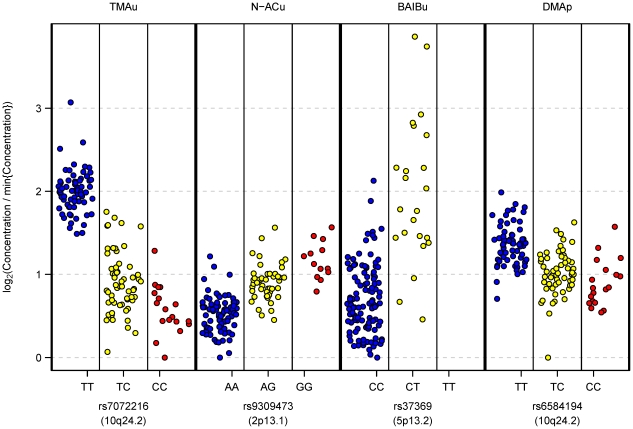
 , where
  denotes the vector of normalized peak heights at that peak (prior to any logarithmic transformation, as described in
Materials and Methods
). So, the transformation maps to zero the lowest observed concentration of each metabolite, and log2(fold change) can be visually quantified relative to this baseline level. In particular, the maximum observed log2(fold change) in a metabolite's concentration is easily accessible from the plot. Within-participant replicate observations (biological and technical) were averaged on log2 scale.
denotes the vector of normalized peak heights at that peak (prior to any logarithmic transformation, as described in
Materials and Methods
). So, the transformation maps to zero the lowest observed concentration of each metabolite, and log2(fold change) can be visually quantified relative to this baseline level. In particular, the maximum observed log2(fold change) in a metabolite's concentration is easily accessible from the plot. Within-participant replicate observations (biological and technical) were averaged on log2 scale.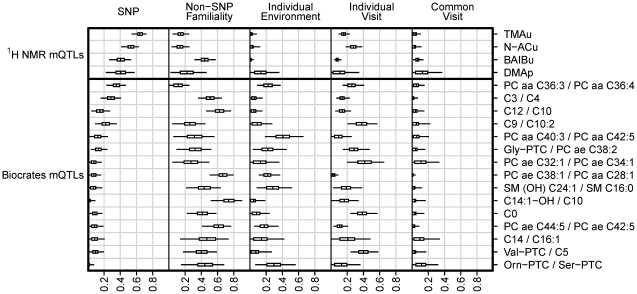
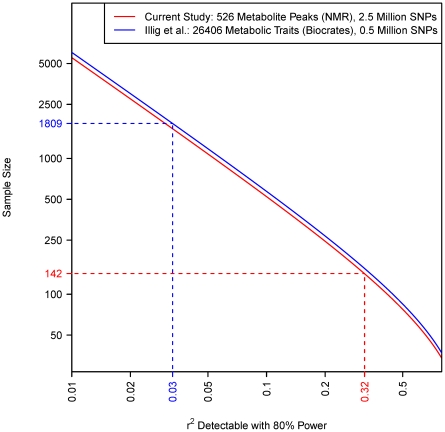
 , which is the proportion of total population variance in metabolite concentration explained by the mQTL genotype (or, equivalently, the squared correlation between genotype and trait). It is assumed that the family-wise error rate in each study is controlled at 0.05 using the Bonferroni method. The number of tests performed is calculated as the product of the SNP and metabolite counts, as shown in the legend. Dashed lines relate the actual sample size of each study to that study's detectable effect size.
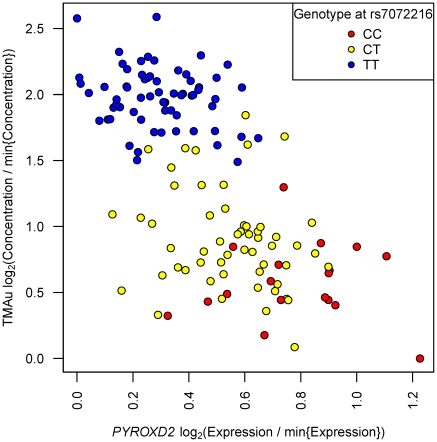
 , on each of the vertical and horizontal axes have been transformed
  . This transformation sets the minimum observation to zero on log2 scale, and presents log2(fold change) relative to the minimum value.
Comment in
-
Human metabolic individuality in biomedical and pharmaceutical research.Circ Cardiovasc Genet. 2011 Dec;4(6):714-5. doi: 10.1161/CIRCGENETICS.111.962175. Circ Cardiovasc Genet. 2011. PMID: 22187452 No abstract available.
References
-
- Veyrieras J-B, Kudaravalli S, Kim S, Dermitzakis E, Gilad Y, et al. High-resolution mapping of expression-QTLs yields insight into human gene regulation. PLoS Genet. 2008;4:e1000214. doi: 10.1371/journal.pgen.1000214. - DOI - PMC - PubMed
