

Transcriptome kinetics is governed by a genome-wide coupling of mRNA production and degradation: a role for RNA Pol II
- PMID: 21931566
- PMCID: PMC3169527
- DOI: 10.1371/journal.pgen.1002273
Transcriptome kinetics is governed by a genome-wide coupling of mRNA production and degradation: a role for RNA Pol II
Erratum in
- PLoS Genet. 2011 Sep;7(9). doi: 10.1371/annotation/7919492c-3e4b-4363-96da-f75281c1340c doi: 10.1371/annotation/7919492c-3e4b-4363-96da-f75281c1340c
Abstract
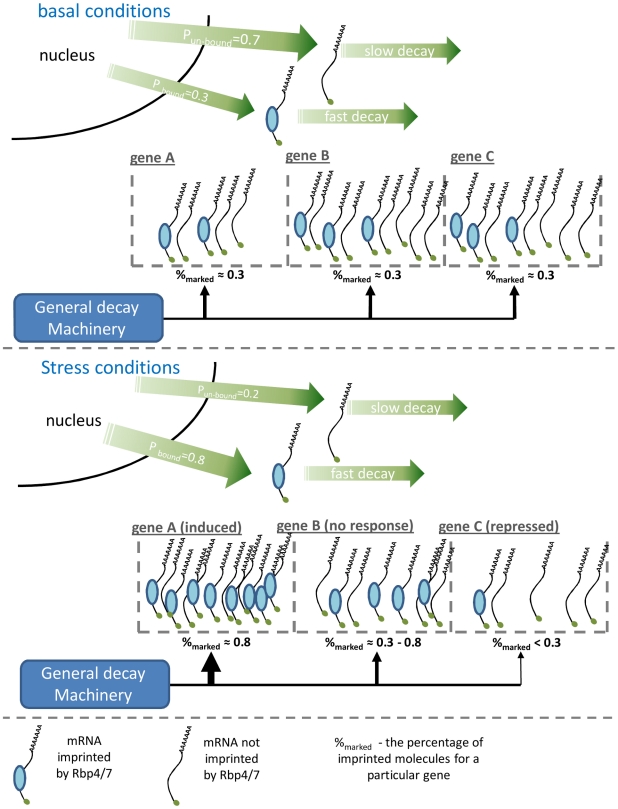
Transcriptome dynamics is governed by two opposing processes, mRNA production and degradation. Recent studies found that changes in these processes are frequently coordinated and that the relationship between them shapes transcriptome kinetics. Specifically, when transcription changes are counter-acted with changes in mRNA stability, transient fast-relaxing transcriptome kinetics is observed. A possible molecular mechanism underlying such coordinated regulation might lay in two RNA polymerase (Pol II) subunits, Rpb4 and Rpb7, which are recruited to mRNAs during transcription and later affect their degradation in the cytoplasm. Here we used a yeast strain carrying a mutant Pol II which poorly recruits these subunits. We show that this mutant strain is impaired in its ability to modulate mRNA stability in response to stress. The normal negative coordinated regulation is lost in the mutant, resulting in abnormal transcriptome profiles both with respect to magnitude and kinetics of responses. These results reveal an important role for Pol II, in regulation of both mRNA synthesis and degradation, and also in coordinating between them. We propose a simple model for production-degradation coupling that accounts for our observations. The model shows how a simple manipulation of the rates of co-transcriptional mRNA imprinting by Pol II may govern genome-wide transcriptome kinetics in response to environmental changes.
Conflict of interest statement
The authors have declared that no competing interests exist.
Figures
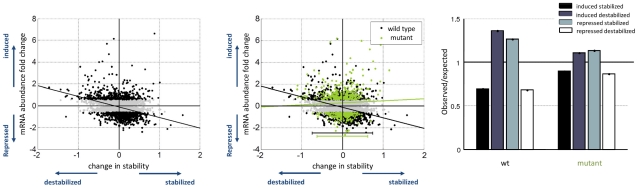
 ) is plotted against the maximal fold change, defined as the maximal change in mRNA abundance for each gene across the time course. (A) Shows the wild type strain where black dots marks genes which respond to the stress. A negative correlation bywhich induced genes are destabilized is illustrated by the plotted least square line (R = −0.23, −log10(p-value)>58). Fitted line y = −0.97x−0.12 with (−1.14, −0.7947) and (−0.1875, −0.05864) 95% confidence interval for each parameter. (B) The mutant measurements are plotted on top of the wild type. The negative correlation observed in the wild type, reflected by the black least straight line, is almost completely eliminated, displayed in the green least square line (R = −0.06, −log10(p-value)<6). Fitted line y = 0.1852x+0.27 with (−0.1723, 0.5426) and (0.1596, 0.3805) confidence interval for each parameter. Also the width of the distribution across the x-axis is slightly narrower for the mutant strain an indication for reduced ability to modulate mRNA stability. (C) Fold enrichment for the change in stability in induced and repressed genes. The number of observed stabilized and destabilized genes within both induced and repressed groups of genes divided by the expected number, assuming no correlation. Expected number is calculated as the percentage of stabilized/destabilized genes in the genome times the induced/repressed group size.
References
-
- Bernstein JA, Khodursky AB, Lin P-H, Lin-Chao S, Cohen SN. Global analysis of mRNA decay and abundance in Escherichia coli at single-gene resolution using two-color fluorescent DNA microarrays. Proceedings of the National Academy of Sciences of the United States of America. 2002;99:9697–702. - PMC - PubMed
-
- García-Martínez J, Aranda A, Pérez-Ortín JE. Genomic run-on evaluates transcription rates for all yeast genes and identifies gene regulatory mechanisms. Molecular cell. 2004;15:303–13. - PubMed
Publication types
MeSH terms
Substances
LinkOut - more resources
Full Text Sources
Molecular Biology Databases
