

Subcutaneous fascial bands--a qualitative and morphometric analysis
- PMID: 21931632
- PMCID: PMC3169545
- DOI: 10.1371/journal.pone.0023987
Subcutaneous fascial bands--a qualitative and morphometric analysis
Abstract
Background: Although fascial bands within the subcutaneous (SQ) layer are commonly seen in ultrasound images, little is known about their functional role, much less their structural characteristics. This study's objective is to describe the morphological features of SQ fascial bands and to systematically evaluate the bands using image analyses tools and morphometric measures.
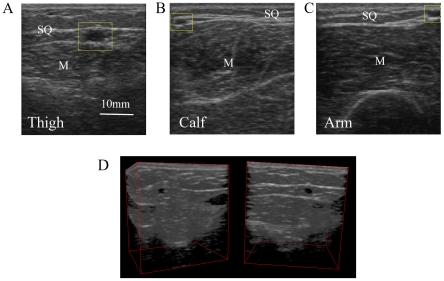
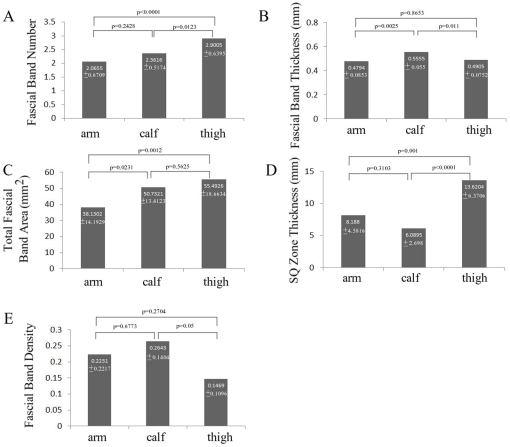
Methods: In 28 healthy volunteers, ultrasound images were obtained at three body locations: the lateral aspect of the upper arm, medial aspect of the thigh and posterior aspect of lower leg. Using image analytical techniques, the total SQ band area, fascial band number, fascial band thickness, and SQ zone (layer) thickness were determined. In addition, the SQ spatial coherence was calculated based on the eigenvalues associated with the largest and smallest eigenvectors of the images.
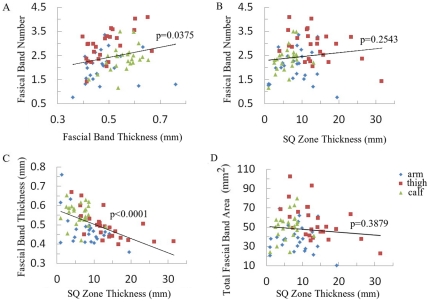
Results: Fascial bands at these sites were contiguous with the dermis and the epimysium forming an interconnected network within the subcutaneous tissue. Subcutaneous blood vessels were also frequently encased by these fascial bands. The total SQ fascial band area was greater at the thigh and calf compared to the arm and was unrelated to SQ layer (zone) thickness. The thigh was associated with highest average number of fascial bands while calf was associated with the greatest average fascial band thickness. Across body regions, greater SQ zone thickness was associated with thinner fascial bands. SQ coherence was significantly associated with SQ zone thickness and body location (calf with statistically greater coherence compared to arm).
Conclusion: Fascial bands are structural bridges that mechanically link the skin, subcutaneous layer, and deeper muscle layers. This cohesive network also encases subcutaneous vessels and may indirectly mediate blood flow. The quantity and morphological characteristics of the SQ fascial band may reflect the composite mechanical forces experienced by the body part.
Conflict of interest statement
Figures


Similar articles
-
Spatial anisotropy analyses of subcutaneous tissue layer: potential insights into its biomechanical characteristics.J Anat. 2011 Oct;219(4):515-24. doi: 10.1111/j.1469-7580.2011.01407.x. Epub 2011 Jul 4. J Anat. 2011. PMID: 21722103 Free PMC article.
-
An anatomical comparison of the fasciae of the thigh: A macroscopic, microscopic and ultrasound imaging study.J Anat. 2021 Apr;238(4):999-1009. doi: 10.1111/joa.13360. Epub 2020 Nov 20. J Anat. 2021. PMID: 33219512 Free PMC article.
-
The membranous layer of superficial fascia: evidence for its widespread distribution in the body.Surg Radiol Anat. 2006 Dec;28(6):606-19. doi: 10.1007/s00276-006-0142-8. Epub 2006 Oct 24. Surg Radiol Anat. 2006. PMID: 17061033
-
The fascia: the forgotten structure.Ital J Anat Embryol. 2011;116(3):127-38. Ital J Anat Embryol. 2011. PMID: 22852442 Review.
-
Furnishing Wound Repair by the Subcutaneous Fascia.Int J Mol Sci. 2021 Aug 20;22(16):9006. doi: 10.3390/ijms22169006. Int J Mol Sci. 2021. PMID: 34445709 Free PMC article. Review.
Cited by
-
Subcutaneous tissue ultrasonography in legs with dependent edema and secondary lymphedema.Ann Vasc Dis. 2014;7(1):21-7. doi: 10.3400/avd.oa.13-00107. Epub 2014 Feb 4. Ann Vasc Dis. 2014. PMID: 24719658 Free PMC article.
-
Applying a systems approach to thyroid physiology: Looking at the whole with a mitochondrial perspective instead of judging single TSH values or why we should know more about mitochondria to understand metabolism.BBA Clin. 2017 Apr 4;7:127-140. doi: 10.1016/j.bbacli.2017.03.004. eCollection 2017 Jun. BBA Clin. 2017. PMID: 28417080 Free PMC article. Review.
-
Tolterodine Tartrate Loaded Cationic Elastic Liposomes for Transdermal Delivery: In Vitro, Ex Vivo, and In Vivo Evaluations.Pharm Res. 2024 Aug;41(8):1683-1702. doi: 10.1007/s11095-024-03741-y. Epub 2024 Jul 24. Pharm Res. 2024. PMID: 39048880
-
Imaging features of nodular fasciitis: a review of 89 cases.Skeletal Radiol. 2025 Jun 24. doi: 10.1007/s00256-025-04973-8. Online ahead of print. Skeletal Radiol. 2025. PMID: 40553400
-
Immediate Effects of Myofascial Release Treatment on Lumbar Microcirculation: A Randomized, Placebo-Controlled Trial.J Clin Med. 2023 Feb 4;12(4):1248. doi: 10.3390/jcm12041248. J Clin Med. 2023. PMID: 36835784 Free PMC article.
References
-
- Hollinshead WH, Rosse C. Philadelphia: Harper and Row; 1985. Textbook of anatomy.
-
- Abu-Hijleh MF, Roshier AL, Al-Shboul Q, Dharap AS, Harris PF, et al. The membranous layer of superficial fascia: evidence for its widespread distribution in the body. Surg Radiol Anat. 2006;28(6):606–19. - PubMed
-
- Jahne B. Berlin: Springer-Verlag; 1993. Spatial-temporal image processing: theory and scientific applications.
Publication types
MeSH terms
Substances
Grants and funding
LinkOut - more resources
Full Text Sources
