. 2011;6(9):e24078.
doi: 10.1371/journal.pone.0024078. Epub 2011 Sep 8.

Memory B cell antibodies to HIV-1 gp140 cloned from individuals infected with clade A and B viruses

Affiliations

Memory B cell antibodies to HIV-1 gp140 cloned from individuals infected with clade A and B viruses

Hugo Mouquet et al. PLoS One. 2011.

Abstract

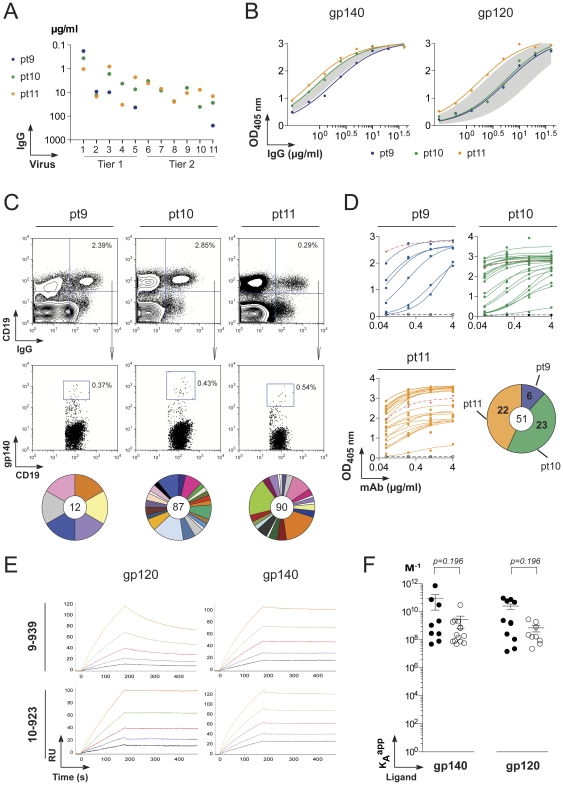
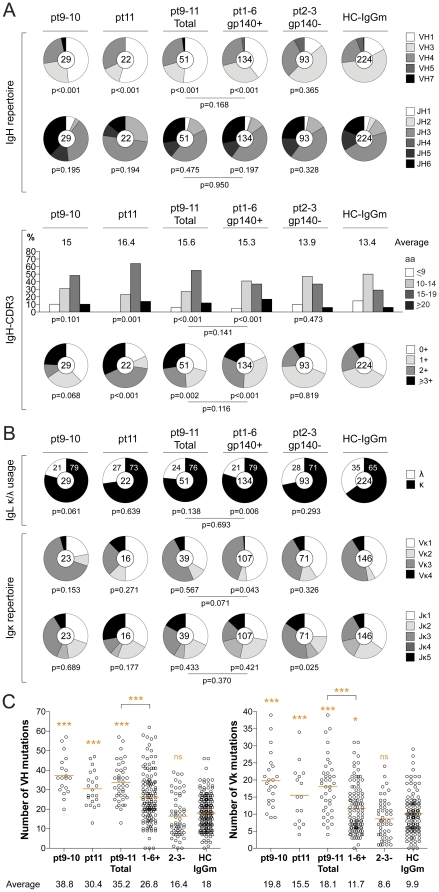
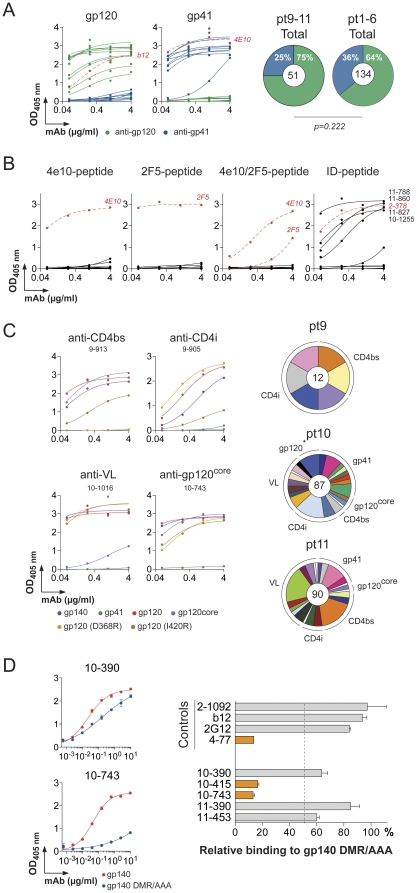
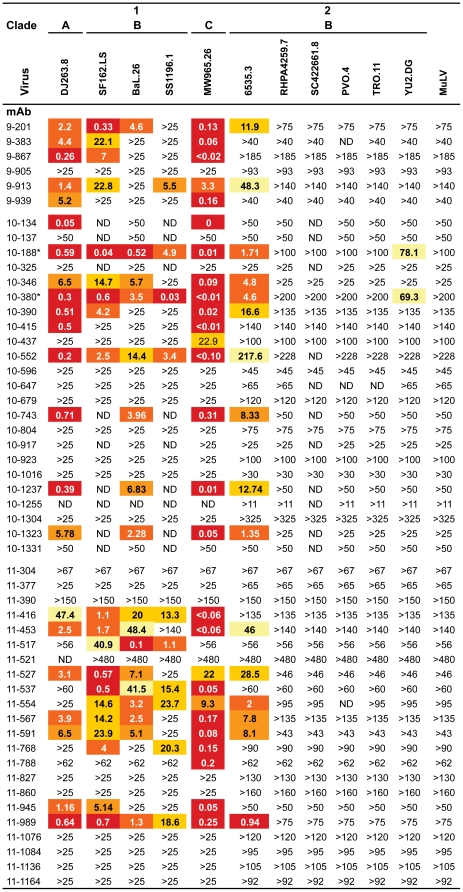
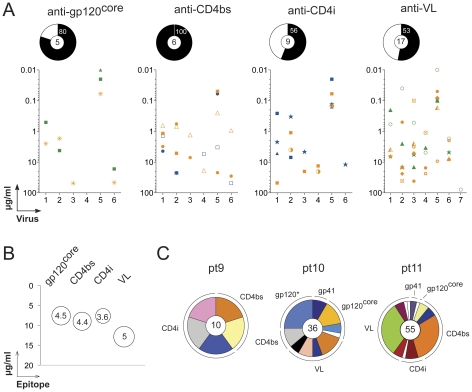
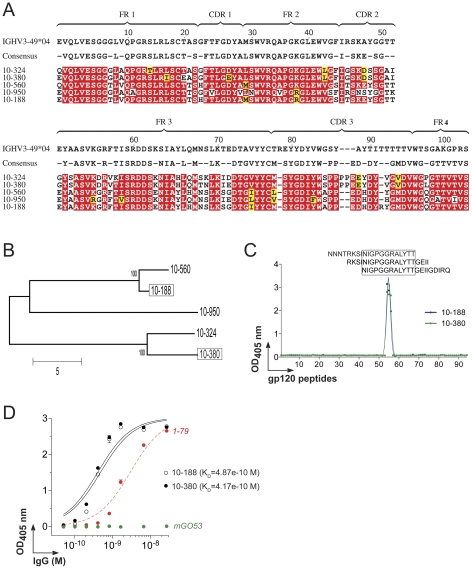
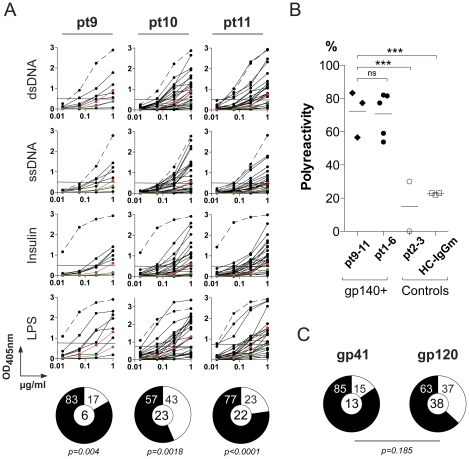
Understanding the antibody response to HIV-1 in humans that show broad neutralizing serologic activity is a crucial step in trying to reproduce such responses by vaccination. Investigating antibodies with cross clade reactivity is particularly important as these antibodies may target conserved epitopes on the HIV envelope gp160 protein. To this end we have used a clade B YU-2 gp140 trimeric antigen and single-cell antibody cloning methods to obtain 189 new anti-gp140 antibodies representing 51 independent B cell clones from the IgG memory B cells of 3 patients infected with HIV-1 clade A or B viruses and exhibiting broad neutralizing serologic activity. Our results support previous findings showing a diverse antibody response to HIV gp140 envelope protein, characterized by differentially expanded B-cell clones producing highly hypermutated antibodies with heterogenous gp140-specificity and neutralizing activity. In addition to their high-affinity binding to the HIV spike, the vast majority of the new anti-gp140 antibodies are also polyreactive. Although none of the new antibodies are as broad or potent as VRC01 or PG9, two clonally-related antibodies isolated from a clade A HIV-1 infected donor, directed against the gp120 variable loop 3, rank in the top 5% of the neutralizers identified in our large collection of 185 unique gp140-specific antibodies in terms of breadth and potency.


Conflict of interest statement

Competing Interests: The authors have declared that no competing interests exist.

Figures

Figure 1
Figure 1. Production of anti-gp140 HIV antibodies from single memory B cells.
A. Neutralization activity of purified IgGs from HIV-infected patients (pt9-11) sera measured by TZM-bl assay. The y-axis shows the IgG concentration required to achieve IC50 for each viruses indicated on the x-axis: 1, MW965.26, 2, DJ263.8; 3, SF162.LS; 4, SS1196.1; 5, BaL26; 6, 6535,3; 7, RHPA4259.7; 8, SC422661.8; 9, TRO.11; 10, PVO.4 for pt9 and pt10, and CAAN5342.A2 for pt11; 11, YU2.DG. B. IgG antibody reactivity of pt9-11 patient sera against YU-2 trimeric gp140 and gp120 proteins determined by ELISA. The grey area indicates the reactivity range of the serum IgGs from previously studied clade B HIV-infected patients (pt1 to pt6) used as comparison. C. Flow cytometry plots show the staining of patient PBMC with gp140 protein, anti-CD19 and anti-IgG antibodies. Gp140-rective IgG memory B cells were identified as gp140+IgG+CD19+ cells in the lymphocyte gate. The pie charts below the flow cytometry plots show for each patient the expansions of gp140-specific B-cell clones. The total number of memory B-cell antibodies is indicated in the center, each pie slice represents a clonal family and the area of the slice is proportional to the number of clonal relatives. Each clonal family is represented by the same color and unique antibodies that are not members of a clonal family are not colored. D. Gp140-antibody binding by ELISA of anti-gp140 monoclonal antibodies isolated from gp140+IgG+CD19+ cells in HIV-infected patients. The red and black dotted lines show positive (b12) and negative (mGO53) antibody controls. All the experiments were performed at least in duplicate. Representative data are shown. The pie chart indicates the numbers of gp140-reactive antibodies produced from each HIV+ donor with the total number in the center. E. Antibody binding to gp140 and gp120 measured by surface _lasmon resonance (SPR). The SPR sensorgrams for antibody binding to gp140 and gp120 overtime are shown for 10-939 and 10-923 as example. The antibodies were tested at concentrations ranging from 2.5 nM (black curve) to 40 nM (orange curve). RU, response units. F. Apparent affinities (KA app) to gp140 and gp120 ligands determined by SPR (as shown in E) for the anti-gp140 antibodies isolated from clade A HIV-infected African patients (filled circles) in comparison to the previously studied gp140-reactive antibodies produced from clade B HIV+ donors (open circles) . Student t-test shows no statistical difference.
Figure 2
Figure 2. Ig gene repertoire of gp140-specific IgG memory B-cell antibodies.
The IgH and IgL chain gene features of anti-gp140 memory B cell antibodies isolated from clade A (pt9 and pt10 shown as a group) and B (pt11) HIV+ patients are shown in comparison to previously published anti-gp140 (pt1-6 gp140+) and non-gp140 reactive (pt2-3 gp140-) antibodies and control antibodies from IgG memory B cells from healthy donors (HC-IgGm) . A. IgH V and J gene usages, CDR3 length and CDR3 positive charge numbers from gp140-specific memory B cell antibodies in clade A and B HIV-infected patients compared to controls. The number of antibody sequences analyzed is indicated in the center of each pie chart. The average of IgH CDR3 length is indicated above each histogram. P-values indicated below the pie charts or histograms and the lines were calculated by comparison to the HC-IgGm and anti-gp140 (pt1-6 gp140+) control antibodies, respectively , . B. IgL κ/λ usage, V and J gene usages for Igκ in gp140-specific memory B cell and control antibodies as shown in A. C. The numbers of mutations in VH and Vκ genes in gp140-specific memory B cell and control antibodies as shown in A. The average number of mutations in VH and Vκ genes is indicated below each dot plot. The p-values were determined by comparison to HC-IgGm and anti-gp140 (pt1-6 gp140+) control antibodies , using unpaired student's t-test.
Figure 3
Figure 3. Epitope mapping of anti-gp140 antibodies.
A. ELISA binding analyses of anti-gp140 antibodies against gp120 and gp41 proteins. Red dotted lines represent the positive antibody controls b12 and 4e10 for gp120 and gp41, respectively , . The pie charts show the distribution of gp120 (green slice) and gp41 (blue slice) reactive antibodies among anti-gp140 antibodies isolated from clade A and B HIV-infected patients. Gp120/gp41 reactivities of previously published anti-gp140 antibodies (from pt1 to pt6 HIV patients) are shown for comparison . The total number of tested antibodies is indicated in the center of each pie chart. 2×2 Fisher' exact test shows no statistical difference. B. ELISA testing of anti-gp41 antibody binding to MPER-peptides (including 4e10- and 2F5-epitopes) and immunodominant (ID) peptide (9 gp41-reactive antibodies tested). ELISA binding curves of positive antibody controls (4e10, 2F5 and 2-378 [25], [31], [32]) are shown in each graph as red dotted lines. C. Antibody binding to gp140, gp120, gp41, gp120core, gp120(D368R) and gp120(I420R) proteins measured by ELISA for representative antibodies directed against the CD4 binding site (CD4bs), the CD4 induced site (CD4i), the variable loops (VL) and the core of gp120 (gp120core). The distribution of the antibody reactivities to the gp41, CD4bs, CD4i, VL and gp120core according to the clonally related B-cell expansions is depicted for each HIV patient as pie charts. The total number of memory B-cell antibodies is indicated in the center, each pie slice represents a clonal family and the area of the slice is proportional to the number of clonal relatives. Each clonal family is represented by the same color and unique antibodies that are not members of a clonal family are not colored. D. Antibody binding to BaL gp140 and gp140(DMR/AAA) mutant protein by ELISA for the representative anti-gp120core antibodies. 10-390 and 10-743 are DMR/AAA-mutation non-sensitive and sensitive, respectively. The bar diagram on the right-hand side shows the relative binding of the anti-gp120core and control antibodies to the gp140(DMR/AAA) mutant compared to the gp140 protein. Error bars indicate the SEM. The orange bars show antibodies sensitive to DMR/AAA-mutation. The cutoff is shown by the dotted line. All the experiments were performed at least in duplicate. Representative data are shown.
Figure 4
Figure 4. Neutralizing activity of anti-gp140 antibodies in TZM-bl assay.
Numbers indicate antibody IgG concentrations in µg/ml to reach the IC50 in the in vitro TZM-bl neutralization assay. > indicates that the IC50 for a given virus was not reached at the concentration tested. 9-1487 antibody was not tested for viral neutralization. *10-188 and 10-380 are clonally related antibodies. ND, not determined. MuLV, Murine leukemia virus, is the negative control.
Figure 5
Figure 5. Neutralizing potency and breadth of anti-gp140 antibodies.
A. The neutralizing activity measured by TZM-bl assay is shown for individual antibodies according to their epitopes (targeted regions of gp120) are shown in the graphs. The y-axis shows the IgG antibody concentration required to achieve IC50 for each viruses indicated on the x-axis: 1, DJ263.8; 2, SF162.LS; 3, BaL26; 4, SS1196.26; 5, MW965.26; 6, 6535,3; 7, YU2.DG. The pie chart above each graph indicates the frequency of antibody neutralizers in each epitope group, with the total number of antibodies tested in the center. B. Antibody neutralizing potency and breadth according to the targeted gp120-epitopes. The bubble plot shows for the antibody neutralizers (with neutralization of at least 2 viruses) grouped by gp120-targetted epitopes (x-axis), the mean IgG antibody concentration required to achieve IC50 (y-axis) and the average number of viruses neutralized (indicated by the bubble size and by the number in the center of the bubble). C. The distribution of the antibody neutralizers (with neutralization of at least 1 virus) binding to the gp140 epitopes according to the clonally related B-cell expansions is depicted for each HIV patient as pie charts. The total number of neutralizing antibodies is indicated in the center, each pie slice represents a clonal family and the area of the slice is proportional to the number of clonal relatives. Each clonal family is represented by the same color and unique antibodies that are not members of a clonal family are not colored. The star indicates that only one virus out 11 was neutralized by the 2 anti-gp41 antibodies.
Figure 6
Figure 6. Sequence analyses and epitope mapping of 10-188 antibody.
A. IgH amino acid alignment of 10-188 with its germline precursor and clonal relatives. Red shading shows amino acid identity, yellow shows biochemical similarity. The consensus sequence is shown above, dashes in this sequence indicate non-conserved residues CDR, complementary determining regions; FR, framework regions. B. Phylogenetic tree of the 10-188 clonal family generated from the IgH sequence alignment shown in A. C. ELISA graph shows the epitope mapping for 10-188 and 10-380 antibodies using as antigens, overlapping 20-mer peptides covering the entire YU-2 gp120 sequence. The amino acid sequence of each numbered peptide is indicated in Table S4. Sequences of the reactive V3 peptides are indicated on top of the curves. D. Graph shows the ELISA measuring the reactivity of 10-188 and 10-380 antibodies against the V3-peptide NNNTRSINIGPGGRALYTT. Green and red lines show the negative (mGO53, [34]) and positive (1–79, [25]) controls, respectively. All the experiments were performed at least in duplicate. Error bars indicate the SEM. Approximate KD values calculated from the ELISA binding curves are indicated.
Figure 7
Figure 7. Polyreactivity of anti-gp140 IgG memory B-cell antibodies.
A. Graphs show ELISAs measuring reactivity against dsDNA, ssDNA, insulin and LPS for IgG antibodies cloned from gp140+ memory B cells from patient pt9, pt10 and pt11. Dotted lines represent the positive control antibody ED38 . Horizontal lines show cut-off OD405 nm for positive reactivity. Green and red lines show the negative control antibody mGO53 and low positive control antibody eiJB40, respectively . All the experiments were performed at least in duplicate. Representative data are shown. Pie charts summarize the frequency of polyreactive (black) and non-polyreactive (white) gp140-reactive memory B cell clones. The number of tested antibodies is indicated in the pie chart center. B. The dot plot shows the polyreactivity frequency of gp140-specific IgG memory B-cell antibodies isolated from pt9-pt11 HIV-patients compared to anti-gp140 antibodies from previous studied patients (pt1 to pt6) and control antibodies (non gp140-binding antibodies from pt2-3 patients and HC-IgGm antibodies [41]). Each symbol represents a donor. Groups were compared using 2×5 Fisher's Exact test. ***, p<0.001. C. Pie charts summarize polyreactivity of anti-gp140 antibodies grouped by antibody specificity for gp41 and gp120. Reactive (black) and non-reactive (white) IgG antibodies, numbers in the center indicate number of antibodies tested. 2×2 Fisher's Exact test shows no statistical difference between both groups.

References

    1. Deeks SG, Schweighardt B, Wrin T, Galovich J, Hoh R, et al. Neutralizing antibody responses against autologous and heterologous viruses in acute versus chronic human immunodeficiency virus (HIV) infection: evidence for a constraint on the ability of HIV to completely evade neutralizing antibody responses. J Virol. 2006;80:6155–6164. - PMC - PubMed
    1. Sather DN, Armann J, Ching LK, Mavrantoni A, Sellhorn G, et al. Factors associated with the development of cross-reactive neutralizing antibodies during human immunodeficiency virus type 1 infection. J Virol. 2009;83:757–769. - PMC - PubMed
    1. Doria-Rose NA, Klein RM, Manion MM, O′Dell S, Phogat A, et al. Frequency and phenotype of human immunodeficiency virus envelope-specific B cells from patients with broadly cross-neutralizing antibodies. J Virol. 2009;83:188–199. - PMC - PubMed
    1. Binley JM, Lybarger EA, Crooks ET, Seaman MS, Gray E, et al. Profiling the specificity of neutralizing antibodies in a large panel of plasmas from patients chronically infected with human immunodeficiency virus type 1 subtypes B and C. J Virol. 2008;82:11651–11668. - PMC - PubMed
    1. Dhillon AK, Donners H, Pantophlet R, Johnson WE, Decker JM, et al. Dissecting the neutralizing antibody specificities of broadly neutralizing sera from human immunodeficiency virus type 1-infected donors. J Virol. 2007;81:6548–6562. - PMC - PubMed

Publication types

MeSH terms

Substances