

GM-CSF production allows the identification of immunoprevalent antigens recognized by human CD4+ T cells following smallpox vaccination
- PMID: 21931646
- PMCID: PMC3170313
- DOI: 10.1371/journal.pone.0024091
GM-CSF production allows the identification of immunoprevalent antigens recognized by human CD4+ T cells following smallpox vaccination
Abstract
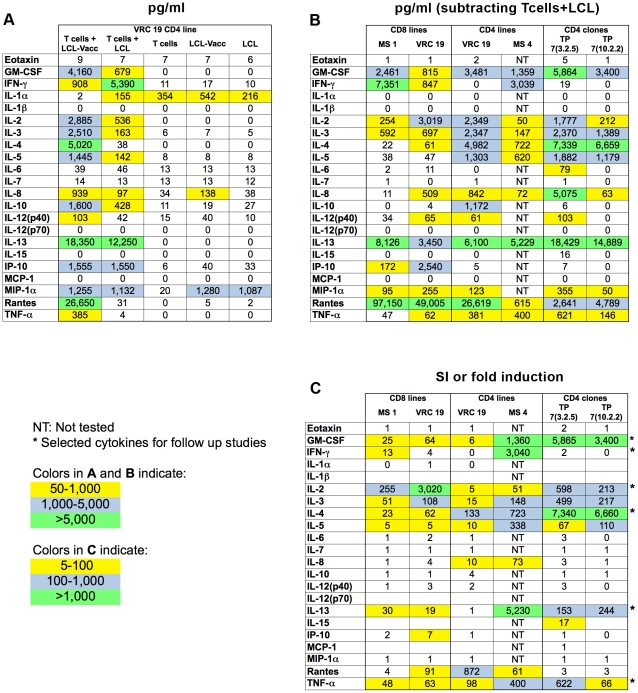
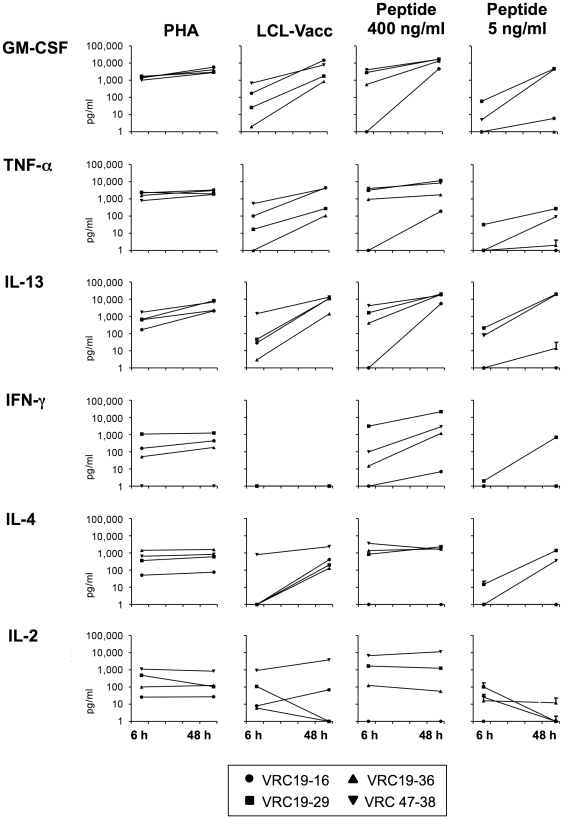
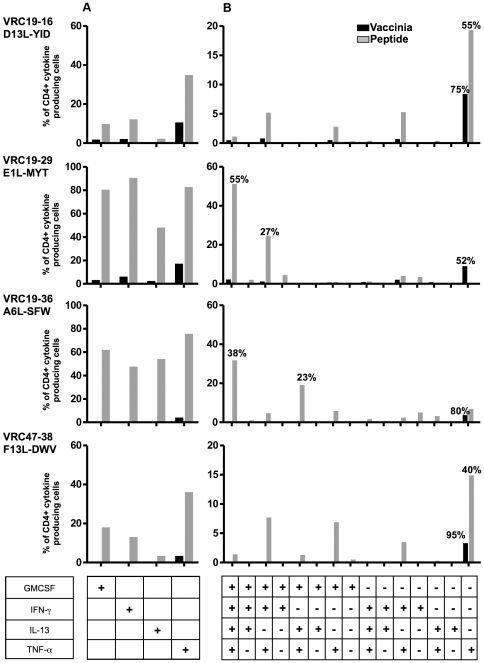
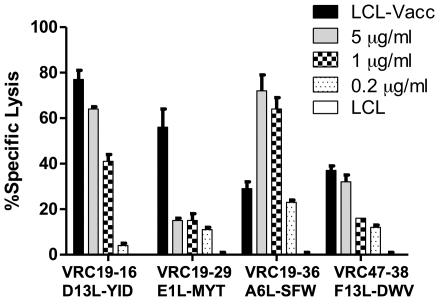
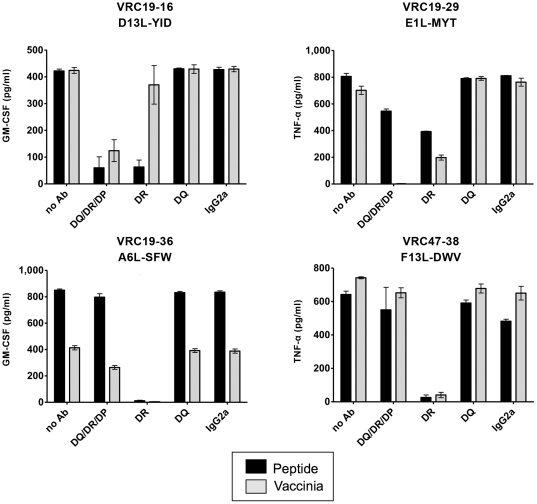
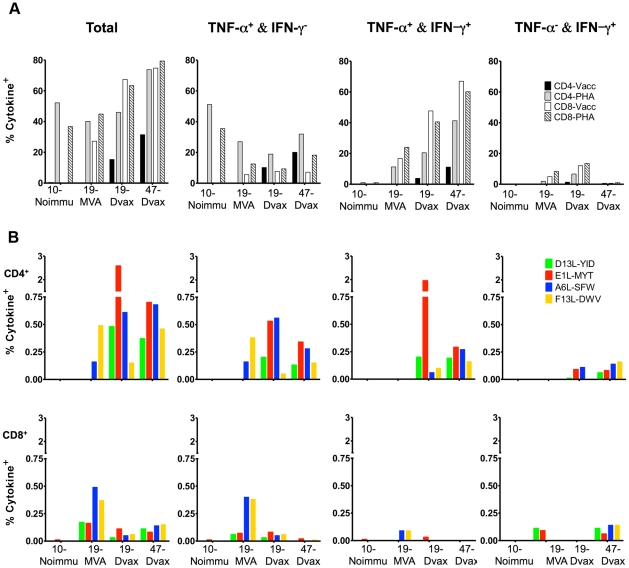
The threat of bioterrorism with smallpox and the broad use of vaccinia vectors for other vaccines have led to the resurgence in the study of vaccinia immunological memory. The importance of the role of CD4+ T cells in the control of vaccinia infection is well known. However, more CD8+ than CD4+ T cell epitopes recognized by human subjects immunized with vaccinia virus have been reported. This could be, in part, due to the fact that most of the studies that have identified human CD4+ specific protein-derived fragments or peptides have used IFN-γ production to evaluate vaccinia specific T cell responses. Based on these findings, we reasoned that analyzing a large panel of cytokines would permit us to generate a more complete analysis of the CD4 T cell responses. The results presented provide clear evidence that TNF-α is an excellent readout of vaccinia specificity and that other cytokines such as GM-CSF can be used to evaluate the reactivity of CD4+ T cells in response to vaccinia antigens. Furthermore, using these cytokines as readout of vaccinia specificity, we present the identification of novel peptides from immunoprevalent vaccinia proteins recognized by CD4+ T cells derived from smallpox vaccinated human subjects. In conclusion, we describe a "T cell-driven" methodology that can be implemented to determine the specificity of the T cell response upon vaccination or infection. Together, the single pathogen in vitro stimulation, the selection of CD4+ T cells specific to the pathogen by limiting dilution, the evaluation of pathogen specificity by detecting multiple cytokines, and the screening of the clones with synthetic combinatorial libraries, constitutes a novel and valuable approach for the elucidation of human CD4+ T cell specificity in response to large pathogens.
Conflict of interest statement
Figures
Similar articles
-
Identification of protective T-cell antigens for smallpox vaccines.Cytotherapy. 2020 Nov;22(11):642-652. doi: 10.1016/j.jcyt.2020.04.098. Epub 2020 May 8. Cytotherapy. 2020. PMID: 32747299 Free PMC article.
-
Real time PCR for the assessment of CD8+ T cellular immune response after prophylactic vaccinia vaccination.J Clin Virol. 2007 Sep;40(1):80-3. doi: 10.1016/j.jcv.2007.04.022. Epub 2007 Jul 20. J Clin Virol. 2007. PMID: 17644471
-
ORFeome approach to the clonal, HLA allele-specific CD4 T-cell response to a complex pathogen in humans.J Immunol Methods. 2009 Aug 15;347(1-2):36-45. doi: 10.1016/j.jim.2009.05.011. Epub 2009 Jun 9. J Immunol Methods. 2009. PMID: 19520082 Free PMC article.
-
Definition of epitopes and antigens recognized by vaccinia specific immune responses: their conservation in variola virus sequences, and use as a model system to study complex pathogens.Vaccine. 2009 Dec 30;27 Suppl 6(Suppl 6):G21-6. doi: 10.1016/j.vaccine.2009.10.011. Vaccine. 2009. PMID: 20006135 Free PMC article. Review.
-
Immunity and immunological memory following smallpox vaccination.Immunol Rev. 2006 Jun;211:320-37. doi: 10.1111/j.0105-2896.2006.00392.x. Immunol Rev. 2006. PMID: 16824139 Review.
Cited by
-
CD4+ T cells provide intermolecular help to generate robust antibody responses in vaccinia virus-vaccinated humans.J Immunol. 2013 Jun 15;190(12):6023-33. doi: 10.4049/jimmunol.1202523. Epub 2013 May 10. J Immunol. 2013. PMID: 23667112 Free PMC article.
-
Cytokine production but lack of proliferation in peripheral blood mononuclear cells from chronic Chagas' disease cardiomyopathy patients in response to T. cruzi ribosomal P proteins.PLoS Negl Trop Dis. 2014 Jun 5;8(6):e2906. doi: 10.1371/journal.pntd.0002906. eCollection 2014 Jun. PLoS Negl Trop Dis. 2014. PMID: 24901991 Free PMC article.
-
Direct Phenotypic Screening in Mice: Identification of Individual, Novel Antinociceptive Compounds from a Library of 734,821 Pyrrolidine Bis-piperazines.ACS Comb Sci. 2016 Jan 11;18(1):51-64. doi: 10.1021/acscombsci.5b00126. Epub 2016 Jan 5. ACS Comb Sci. 2016. PMID: 26651386 Free PMC article.
-
A novel method for the determination of isokinetic ratios and its application in the synthesis of two new positional scanning libraries.ACS Comb Sci. 2012 Sep 10;14(9):503-12. doi: 10.1021/co300060s. Epub 2012 Aug 28. ACS Comb Sci. 2012. PMID: 22913403 Free PMC article.
-
HTS by NMR of combinatorial libraries: a fragment-based approach to ligand discovery.Chem Biol. 2013 Jan 24;20(1):19-33. doi: 10.1016/j.chembiol.2012.10.015. Chem Biol. 2013. PMID: 23352136 Free PMC article.
References
-
- Rock MT, Yoder SM, Wright PF, Talbot TR, Edwards KM, et al. Differential Regulation of Granzyme and Perforin in Effector and Memory T Cells following Smallpox Immunization. J Immunol. 2005;174:3757–3764. - PubMed
-
- Hammarlund E, Lewis MW, Hansen SG, Strelow LI, Nelson JA, et al. Duration of antiviral immunity after smallpox vaccination. Nat Med. 2003;9:1131–1137. - PubMed
Publication types
MeSH terms
Substances
Grants and funding
LinkOut - more resources
Full Text Sources
Medical
Research Materials
