. 2011;6(9):e24307.
doi: 10.1371/journal.pone.0024307. Epub 2011 Sep 12.

Sirtinol treatment reduces inflammation in human dermal microvascular endothelial cells

Affiliations

Sirtinol treatment reduces inflammation in human dermal microvascular endothelial cells

Angela Orecchia et al. PLoS One. 2011.

Erratum in

  • PLoS One. 2011;6(10). doi:10.1371/annotation/0174b439-c62b-42e8-a420-3defbfe5c8e9

Abstract

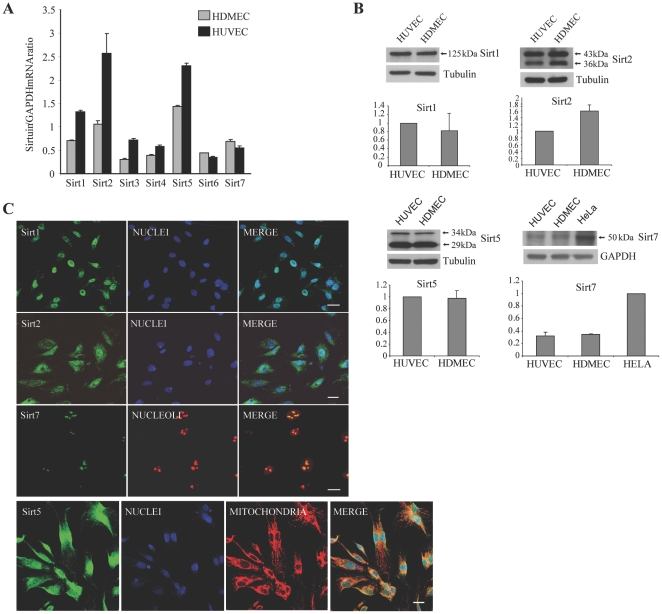
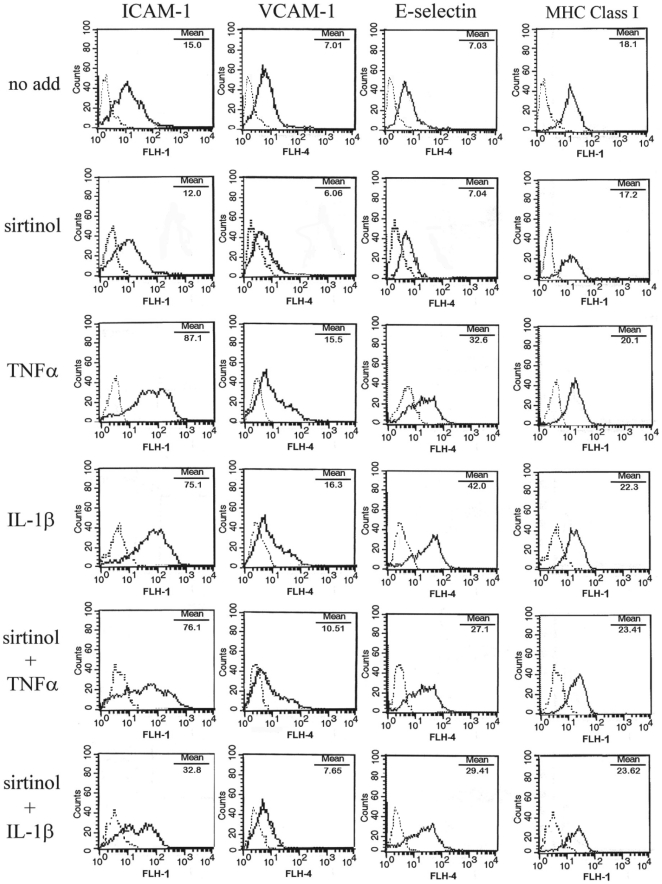
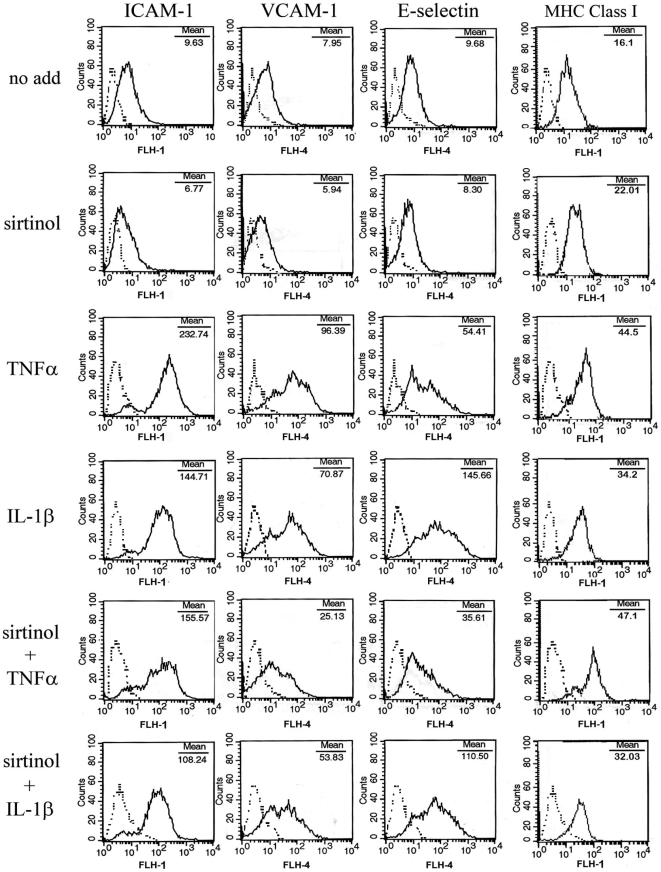
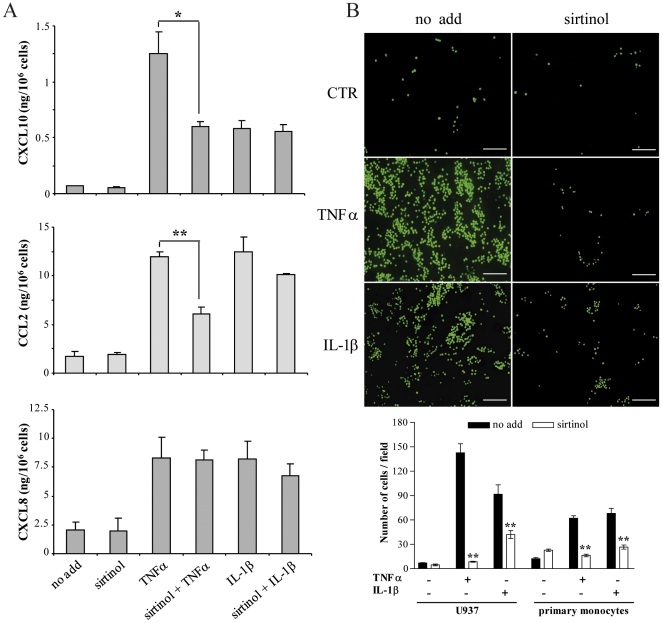
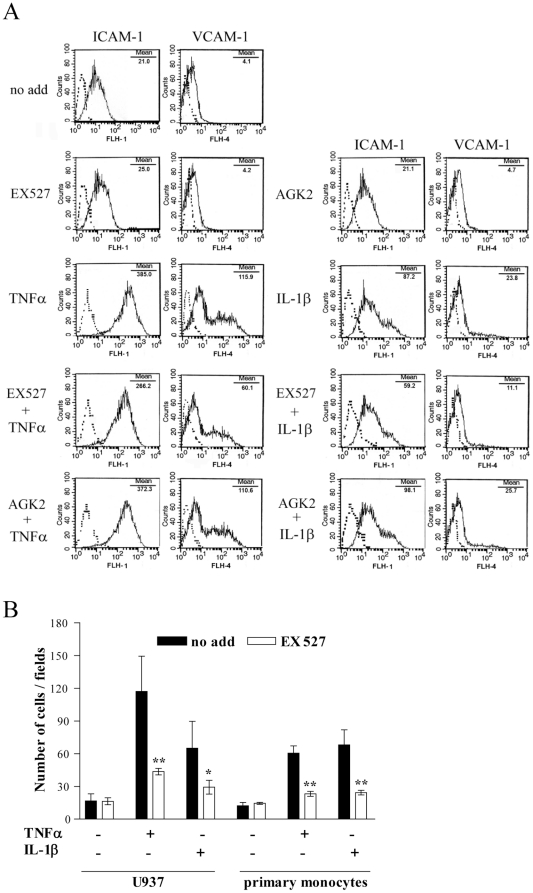
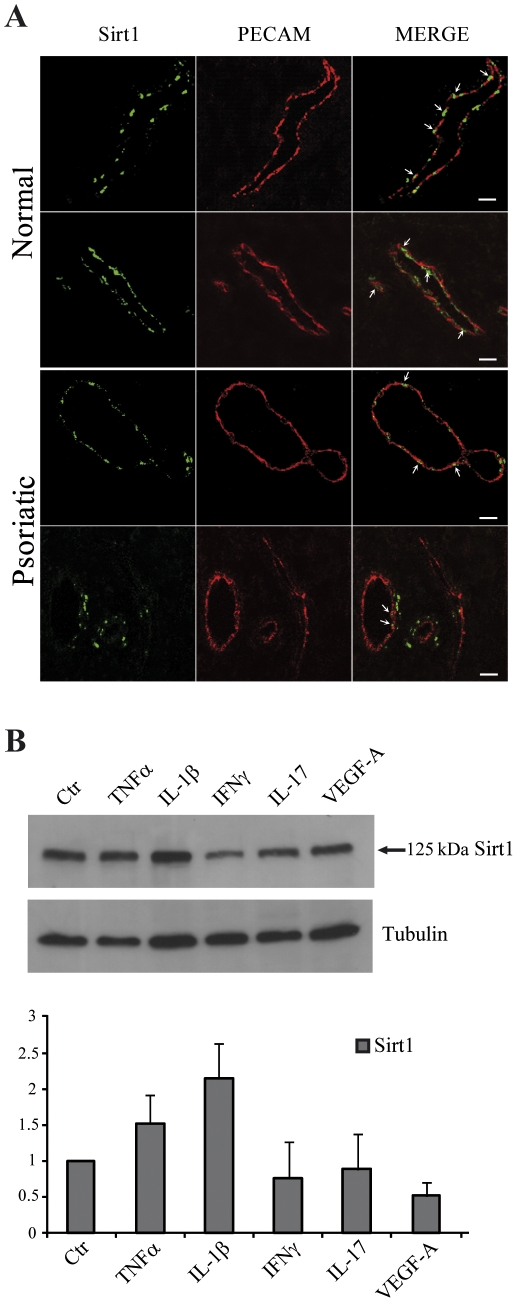
Histone deacetylases (HDAC) are key enzymes in the epigenetic control of gene expression. Recently, inhibitors of class I and class II HDAC have been successfully employed for the treatment of different inflammatory diseases such as rheumatoid arthritis, colitis, airway inflammation and asthma. So far, little is known so far about a similar therapeutic effect of inhibitors specifically directed against sirtuins, the class III HDAC. In this study, we investigated the expression and localization of endogenous sirtuins in primary human dermal microvascular endothelial cells (HDMEC), a cell type playing a key role in the development and maintenance of skin inflammation. We then examined the biological activity of sirtinol, a specific sirtuin inhibitor, in HDMEC response to pro-inflammatory cytokines. We found that, even though sirtinol treatment alone affected only long-term cell proliferation, it diminishes HDMEC inflammatory responses to tumor necrosis factor (TNF)α and interleukin (IL)-1β. In fact, sirtinol significantly reduced membrane expression of adhesion molecules in TNFã- or IL-1β-stimulated cells, as well as the amount of CXCL10 and CCL2 released by HDMEC following TNFα treatment. Notably, sirtinol drastically decreased monocyte adhesion on activated HDMEC. Using selective inhibitors for Sirt1 and Sirt2, we showed a predominant involvement of Sirt1 inhibition in the modulation of adhesion molecule expression and monocyte adhesion on activated HDMEC. Finally, we demonstrated the in vivo expression of Sirt1 in the dermal vessels of normal and psoriatic skin. Altogether, these findings indicated that sirtuins may represent a promising therapeutic target for the treatment of inflammatory skin diseases characterized by a prominent microvessel involvement.


Conflict of interest statement

Competing Interests: The authors have declared that no competing interests exist.

Figures

Figure 1
Figure 1. Sirtuin expression in endothelial cells.
(A) Semi-quantitative RT-PCR of sirtuin expression. Bars refer to mRNA amounts relative to GAPDH mRNA. Results are shown as the mean ± s.d. of at least three experiments. (B) Western blotting of four sirtuins, indicated by arrows, the molecular weights of which are given in kDa. A representative experiment is reported. Tubulin and GAPDH were used as loading controls. The densitometric analysis of three different experiments is shown as the mean ± s.d. HUVEC values for the first three sirtuins and HELA value for Sirt7 were used as reference and reported as 1 (C) Sirtuins were stained with the corresponding primary antibody (left panel). HDMEC were also immunostained with a nuclear or a nucleolus marker (middle panels), or with a mitochondria marker (Sirt5, third panel from the left). Merged pictures in the right panels. Each panel is a total projection of a confocal stack of images; bars  =  20 µm.
Figure 2
Figure 2. Expression of adhesion molecules in sirtinol-treated HDMEC after a 5-hour stimulation.
HDMEC were analyzed for ICAM-1, VCAM-1, E-selectin, and MHC Class I by flow cytometry after 18-hour treatment with medium alone (no add) or 10 µM sirtinol, followed by a 5-hour stimulation with 10 ng/ml of the indicated cytokines. Dotted lines represent staining with matched isotype Ig. The x-axis and the y-axis indicate the relative cell number and mean fluorescence intensity, respectively. Data are representative of at least ten different experiments with similar results.
Figure 3
Figure 3. Expression of adhesion molecules in sirtinol-treated HDMEC after a 24-hour stimulation.
HDMEC were analyzed for ICAM-1, VCAM-1, E-selectin, and MHC Class I expression by flow cytometry after treatment with medium alone (no add) or sirtinol, followed by a 24-hour stimulation with the indicated cytokines. Dotted lines represent staining with matched isotype Ig. The x-axis and the y-axis indicate the relative cell number and mean fluorescence intensity, respectively. Data are representative of at least twelve different experiments with similar results.
Figure 4
Figure 4. Chemokine secretion and monocyte adhesion in sirtinol-treated HDMEC.
(A) HDMEC conditioned medium was analyzed by ELISA after treatment with medium alone (no add) or sirtinol, followed by stimulation with the indicated cytokines. Results are the mean of at least three independent experiments and are given in ng/106 cells ± s.d; *p≤0.01, **p≤0.001, T-student test. (B) Fluorescence-labelled U937 cells or primary monocytes were plated on HDMEC pretreated or not (no add) with sirtinol, and exposed or not (CTR) to TNFα or IL-1β. Adherent cells were quantified as the mean number of fluorescent cells present in 10 randomly selected fields for each condition. Pictures of a representative experiment are shown in the left panels, bar  =  50 µm. Data are expressed as the mean of three different experiments ± s.d (panel below), **p≤0.005, T-student test.
Figure 5
Figure 5. Adhesion molecule expression and monocyte adhesion in EX527- or AGK2-treated HDMEC.
(A) HDMEC were analyzed for ICAM-1 and VCAM-1 expression by flow cytometry after treatment with medium alone (no add), EX527, or AGK2, followed by a 5-hour stimulation with the indicated cytokines. Dotted lines represent staining with matched isotype Ig. The x-axis and the y-axis indicate the relative cell number and mean fluorescence intensity, respectively. Data are representative of three different experiments which gave similar results. (B) Fluorescence-labelled U937 cells or primary monocytes were plated on HDMEC pretreated or not (no add) with EX527, and exposed or not (CTR) to TNFα or IL-1β. Adherent cells were quantified as the mean number of fluorescent cells present in 10 randomly selected fields for each condition. Data are expressed as the mean of three different experiments ± s.d; *p≤0.05, **p≤0.005, T-student test.
Figure 6
Figure 6. Sirt1 expression in skin microvessels.
(A) Sirt1 was stained with the primary antibody (left panels), and endothelial cells were put in evidence with a co-staining for the PECAM/CD31 transmembrane adhesion molecule (middle panels). Merged pictures are in the right panels. Each panel is a total projection of a confocal stack of images; bars  =  20 µm. (B) HDMEC were treated with the indicated cytokines and the cell lysates were analyzed by immunoblotting with an anti-Sirt1 antibody. An antibody against tubulin was used as a loading control. A representative experiment is reported and the densitometric analysis of at least three different experiments is shown as the mean ± s.d.

References

    1. Finkel T, Deng CX, Mostoslavsky R. Recent progress in the biology and physiology of sirtuins. Nature. 2009;460:587–591. - PMC - PubMed
    1. Guarente L, Picard F. Calorie restriction-the SIR2 connection. Cell. 2005;120:473–482. - PubMed
    1. Donmez G, Guarente L. Aging and disease: connections to sirtuins. Aging Cell. 2010;9:285–290. - PubMed
    1. Frye RA. Phylogenic classification of prokaryotic and eukaryotic Sir2-like proteins. Biochem Biophys Res Comm. 2000;273:793–798. - PubMed
    1. Oberdoerffer P, Michan S, McVay M, Mostoslavsky R, Vann J, et al. SIRT1 redistribution on chromatin promotes genomic stability but alters gene expression during aging. Cell. 2008;135:907–918. - PMC - PubMed

Publication types

MeSH terms