

Determinants, discriminants, conserved residues--a heuristic approach to detection of functional divergence in protein families
- PMID: 21931701
- PMCID: PMC3171465
- DOI: 10.1371/journal.pone.0024382
Determinants, discriminants, conserved residues--a heuristic approach to detection of functional divergence in protein families
Abstract
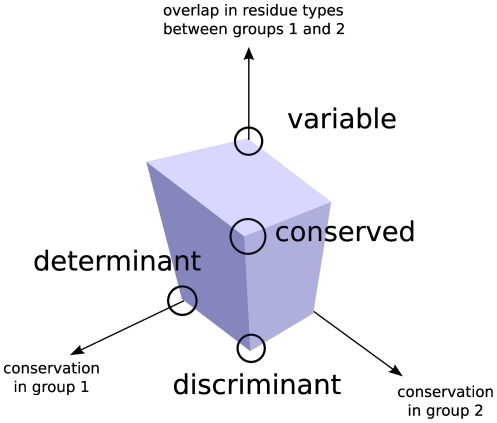
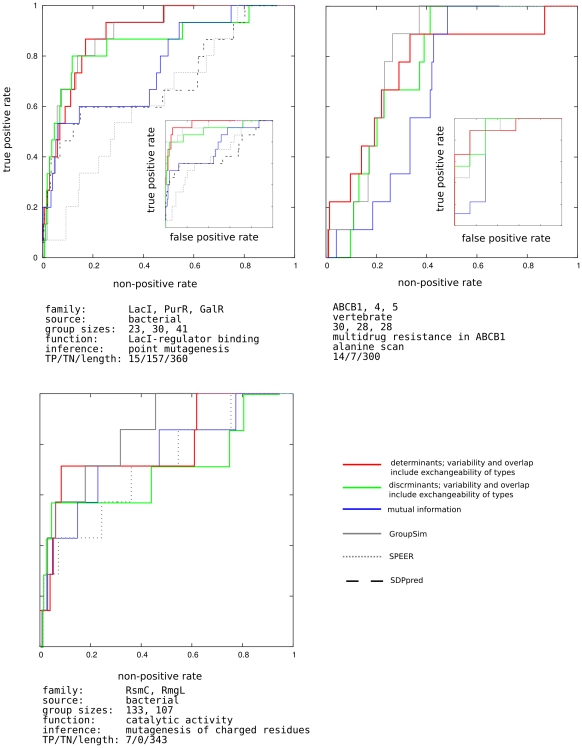
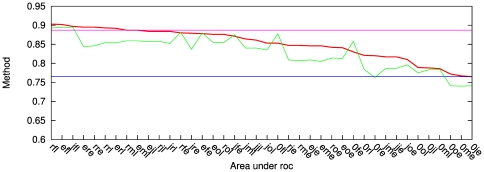
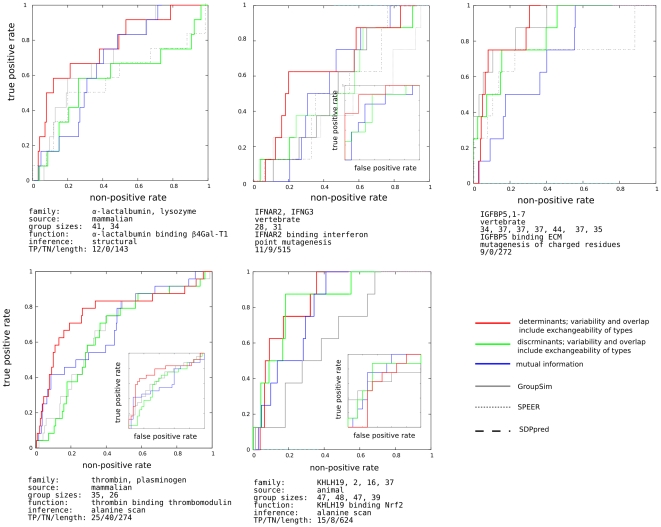
In this work, belonging to the field of comparative analysis of protein sequences, we focus on detection of functional specialization on the residue level. As the input, we take a set of sequences divided into groups of orthologues, each group known to be responsible for a different function. This provides two independent pieces of information: within group conservation and overlap in amino acid type across groups. We build our discussion around the set of scoring functions that keep the two separated and the source of the signal easy to trace back to its source.We propose a heuristic description of functional divergence that includes residue type exchangeability, both in the conservation and in the overlap measure, and does not make any assumptions on the rate of evolution in the groups other than the one under consideration. Residue types acceptable at a certain position within an orthologous group are described as a distribution which evolves in time, starting from a single ancestral type, and is subject to constraints that can be inferred only indirectly. To estimate the strength of the constraints, we compare the observed degrees of conservation and overlap with those expected in the hypothetical case of a freely evolving distribution.Our description matches the experiment well, but we also conclude that any attempt to capture the evolutionary behavior of specificity determining residues in terms of a scalar function will be tentative, because no single model can cover the variety of evolutionary behavior such residues exhibit. Especially, models expecting the same type of evolutionary behavior across functionally divergent groups tend to miss a portion of information otherwise retrievable by the conservation and overlap measures they use.
Conflict of interest statement
Figures
Similar articles
-
Predicting functionally important residues from sequence conservation.Bioinformatics. 2007 Aug 1;23(15):1875-82. doi: 10.1093/bioinformatics/btm270. Epub 2007 May 22. Bioinformatics. 2007. PMID: 17519246
-
Prediction of amino acid positions specific for functional groups in a protein family based on local sequence similarity.J Mol Recognit. 2016 Apr;29(4):159-69. doi: 10.1002/jmr.2515. Epub 2015 Nov 8. J Mol Recognit. 2016. PMID: 26549790
-
Disentangling evolutionary signals: conservation, specificity determining positions and coevolution. Implication for catalytic residue prediction.BMC Bioinformatics. 2012 Sep 14;13:235. doi: 10.1186/1471-2105-13-235. BMC Bioinformatics. 2012. PMID: 22978315 Free PMC article.
-
Practical analysis of specificity-determining residues in protein families.Brief Bioinform. 2016 Mar;17(2):255-61. doi: 10.1093/bib/bbv045. Epub 2015 Jul 2. Brief Bioinform. 2016. PMID: 26141829 Review.
-
A global analysis of function and conservation of catalytic residues in enzymes.J Biol Chem. 2020 Jan 10;295(2):314-324. doi: 10.1074/jbc.REV119.006289. Epub 2019 Dec 3. J Biol Chem. 2020. PMID: 31796628 Free PMC article. Review.
Cited by
-
Cube - an online tool for comparison and contrasting of protein sequences.PLoS One. 2013 Nov 20;8(11):e79480. doi: 10.1371/journal.pone.0079480. eCollection 2013. PLoS One. 2013. PMID: 24363790 Free PMC article.
-
TwinCons: Conservation score for uncovering deep sequence similarity and divergence.PLoS Comput Biol. 2021 Oct 29;17(10):e1009541. doi: 10.1371/journal.pcbi.1009541. eCollection 2021 Oct. PLoS Comput Biol. 2021. PMID: 34714829 Free PMC article.
-
Prediction of Protein-Ligand Interaction Based on the Positional Similarity Scores Derived from Amino Acid Sequences.Int J Mol Sci. 2019 Dec 18;21(1):24. doi: 10.3390/ijms21010024. Int J Mol Sci. 2019. PMID: 31861473 Free PMC article.
-
Multiple co-evolutionary networks are supported by the common tertiary scaffold of the LacI/GalR proteins.PLoS One. 2013 Dec 31;8(12):e84398. doi: 10.1371/journal.pone.0084398. eCollection 2013. PLoS One. 2013. PMID: 24391951 Free PMC article.
-
AlloRep: A Repository of Sequence, Structural and Mutagenesis Data for the LacI/GalR Transcription Regulators.J Mol Biol. 2016 Feb 22;428(4):671-678. doi: 10.1016/j.jmb.2015.09.015. Epub 2015 Sep 25. J Mol Biol. 2016. PMID: 26410588 Free PMC article.
References
-
- Valdar W. Scoring residue conservation. PROTEINS-NEW YORK- 2002;48:227–241. - PubMed
-
- Shannon C, Weaver W. Urbana, Illinois: The University of Illinois Press; 1949. The Mathematical Theory of Communication.
-
- Schneider T, Stormo G, Gold L, Ehrenfeucht A. Information content of binding sites on nucleotide sequences. Journal of Molecular Biology. 1986;188:415–431. - PubMed
-
- Shenkin P, Erman B, Mastrandrea L. Proteins: Struct., Fund. Genetics. 1991;11:297. - PubMed
Publication types
MeSH terms
Substances
LinkOut - more resources
Full Text Sources
Research Materials
