Meta-Analysis
. 2011;6(9):e24387.
doi: 10.1371/journal.pone.0024387. Epub 2011 Sep 9.

Calcineurin-inhibitor minimization in liver transplant patients with calcineurin-inhibitor-related renal dysfunction: a meta-analysis

Affiliations
Meta-Analysis

Calcineurin-inhibitor minimization in liver transplant patients with calcineurin-inhibitor-related renal dysfunction: a meta-analysis

Yuan Kong et al. PLoS One. 2011.

Abstract

Background: Introduction of calcineurin-inhibitor (CNI) has made transplantation a miracle in the past century. However, the side effects of long-term use of CNI turn out to be one of the major challenges in the current century. Among these, renal dysfunction attracts more and more attention. Herein, we undertook a meta-analysis to evaluate the efficacy and safety of calcineurin-inhibitor (CNI) minimization protocols in liver transplant recipients with CNI-related renal dysfunction.

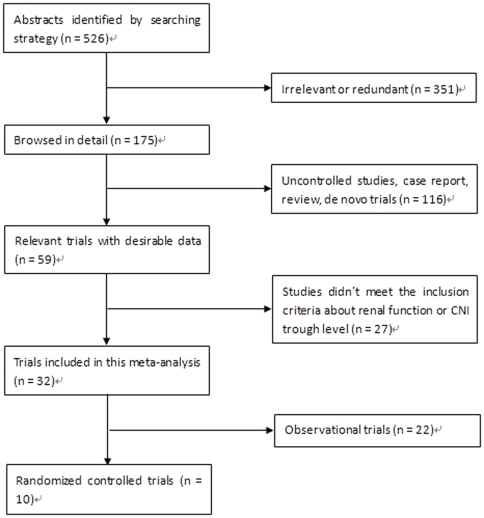
Methods: We included randomized trials with no year and language restriction. All data were analyzed using random effect model by Review Manager 5.0. The primary endpoints were glomerular filtration rate (GFR), serum creatinine level (sCr) and creatinine clearance rate (CrCl), and the secondary endpoints were acute rejection episodes, incidence of infection and patient survival at the end of follow-up.

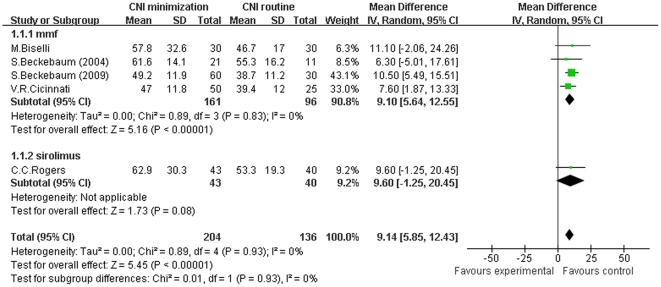
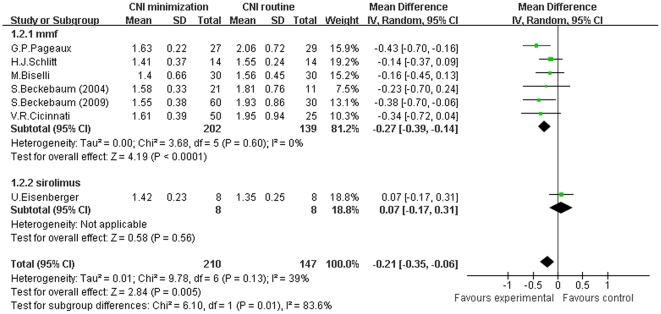
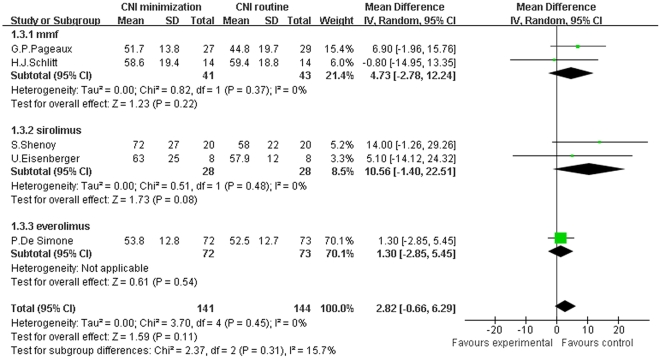
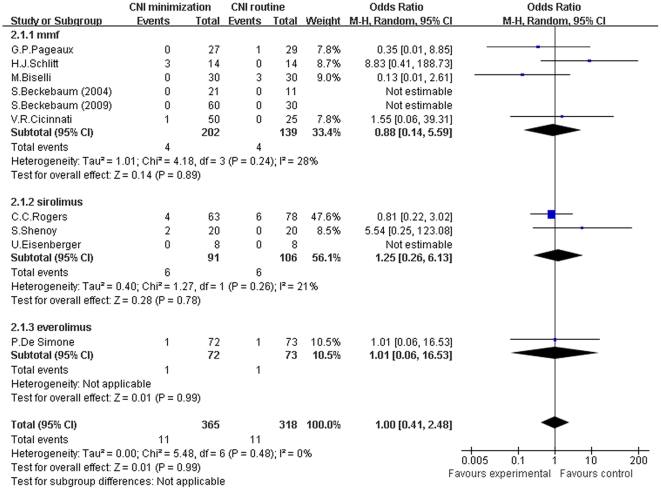
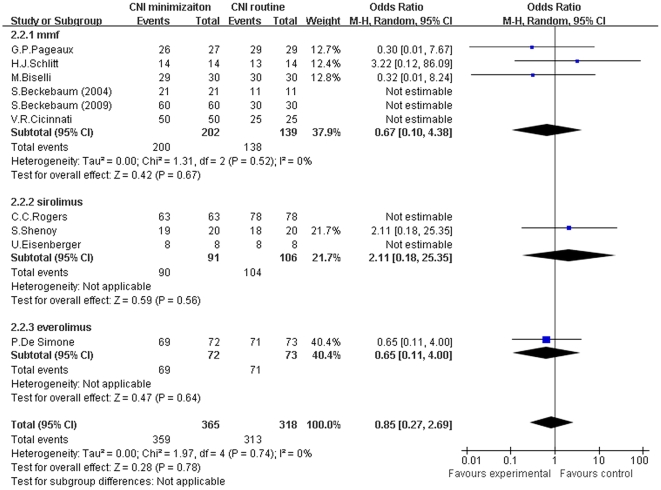
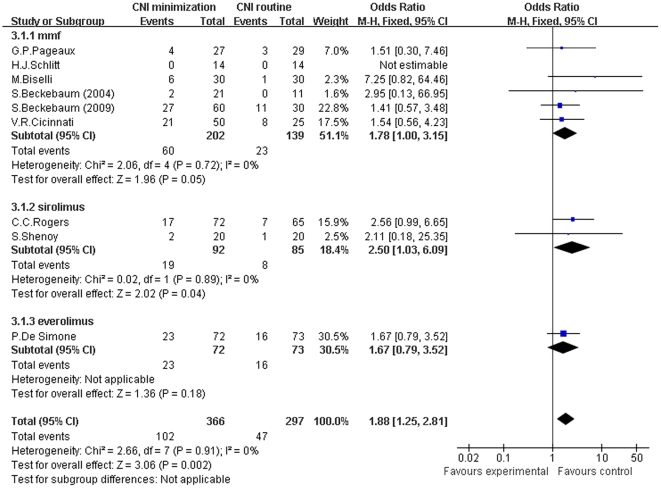
Results: GFR was significantly improved in CNI minimization group than in routine CNI regimen group (Z = 5.45, P<0.00001; I(2) = 0%). Likely, sCr level was significantly lower in the CNI minimization group (Z = 2.84, P = 0.005; I(2) = 39%). However, CrCl was not significantly higher in the CNI minimization group (Z = 1.59, P = 0.11; I(2) = 0%). Both acute rejection episodes and patient survival were comparable between two groups (rejection: Z = 0.01, P = 0.99; I(2) = 0%; survival: Z = 0.28, P = 0.78; I(2) = 0%, respectively). However, current CNI minimization protocols may be related to a higher incidence of infections (Z = 3.06, P = 0.002; I(2) = 0%).

Conclusion: CNI minimization can preserve or even improve renal function in liver transplant patients with renal impairment, while sharing similar short term acute rejection rate and patient survival with routine CNI regimen.


Conflict of interest statement

Competing Interests: The authors have declared that no competing interests exist.

Figures

Figure 1
Figure 1. Flow diagram of study identification.
Figure 2
Figure 2. Meta-analysis of CNI minimization versus routine CNI regimen in GFR (RCTs).
In MMF subgroup, the GFR of recipients was significantly higher than in routine CNI regimen group. In sirolimus subgroup, the improvement of GFR over routine CNI regimen group was not statistically significant. In the total 10 RCTs, the GFR was significantly improved. Z = total effect size, I2 = heterogeneity index. Columns in green represent the mean difference of each study and column size represents the study weight in the analysis. Lanes represent the 95% CI of each study. Diamonds in black represent the overall effect size and diamond width represents the overall 95% CI.
Figure 3
Figure 3. Meta-analysis of CNI minimization versus routine CNI regimen in sCr (RCTs).
In MMF subgroup, the sCr level was significantly lower than in routine CNI regimen group. In sirolimus subgroup, the decrease of sCr level was not statistically significant. In the total 10 RCTs, the sCr level was significantly decreased in CNI minimization group. Z = total effect size, I2 = heterogeneity index. Columns in green represent the mean difference of each study and column size represents the study weight in the analysis. Lanes represent the 95% CI of each study. Diamonds in black represent the overall effect size and diamond width represents the overall 95% CI.
Figure 4
Figure 4. Meta-analysis of CNI minimization versus routine CNI regimen in CrCl (RCTs).
In MMF, sirolimus and everolimus subgroup, the improvement of CrCl over routine CNI regimen group was not statistically significant, as well as in the total 10 RCTs. Z = total effect size, I2 = heterogeneity index. Columns in green represent the mean difference of each study and column size represents the study weight in the analysis. Lanes represent the 95% CI of each study. Diamonds in black represent the overall effect size and diamond width represents the overall 95% CI.
Figure 5
Figure 5. Meta-analysis of CNI minimization versus routine CNI regimen in acute rejection (RCTs).
There was no significant difference between CNI minimization and routine CNI regimen group in all subgroup and total analysis. Z = total effect size, I2 = heterogeneity index. Columns in blue represent the odds ratio of each study and column size represents the study weight in the analysis. Lanes represent the 95% CI of each study. Diamonds in black represent the overall effect size and diamond width represents the overall 95% CI.
Figure 6
Figure 6. Meta-analysis of CNI minimization versus routine CNI regimen in infection incidence (RCTs).
In MMF and everolimus subgroup, the difference of infection incidence was not statistically significant. In sirolimus subgroup, the infection incidence was significantly higher than in routine CNI regimen group. In total, the infection incidence was significantly higher in CNI minimization group. Z = total effect size, I2 = heterogeneity index. Columns in blue represent the odds ratio of each study and column size represents the study weight in the analysis. Lanes represent the 95% CI of each study. Diamonds in black represent the overall effect size and diamond width represents the overall 95% CI.
Figure 7
Figure 7. Meta-analysis of CNI minimization versus routine CNI regimen in patient survival (RCTs).
There was no significant difference between CNI minimization and routine CNI regimen group in all subgroup and total analysis. Z = total effect size, I2 = heterogeneity index. Columns in blue represent the odds ratio of each study and column size represents the study weight in the analysis. Lanes represent the 95% CI of each study. Diamonds in black represent the overall effect size and diamond width represents the overall 95% CI.

References

    1. Organ Procurement and Transplant Network. Available: http://optn.transplant.hrsa.gov/LatestData/viewDataReports.asp via the Internet. Accessed June 2011.
    1. Ojo AO, Held PJ, Port FK, Wolfe RA, Leichtman AB, et al. Chronic renal failure after transplantation of a nonrenal organ. N Engl J Med. 2003;349:931–940. - PubMed
    1. Lebron Gallardo M, Herrera Gutierrez ME, Seller Perez G, Curiel Balsera E, Fernandez Ortega JF, et al. Risk factors for renal dysfunction in the postoperative course of liver transplant. Liver Transpl. 2004;11:1379–1385. - PubMed
    1. Pawarode A, Fine DM, Thuluwath PJ. Independent risk factors and natural history of renal dysfunction in liver transplant recipients. Liver Transpl. 2003;9:741–747. - PubMed
    1. Moreno JM, Cuervas-Mons V, Rubio E, Pons F, Herreros de TA, et al. Chronic renal dysfunction after liver transplantation in adult patients: prevalence, risk factors, and impact on mortality. Transplant Proc. 2003;35:1907–1908. - PubMed

Publication types