. 2011;6(9):e24407.
doi: 10.1371/journal.pone.0024407. Epub 2011 Sep 9.

Antitumor effect of malaria parasite infection in a murine Lewis lung cancer model through induction of innate and adaptive immunity

Affiliations

Antitumor effect of malaria parasite infection in a murine Lewis lung cancer model through induction of innate and adaptive immunity

Lili Chen et al. PLoS One. 2011.

Abstract

Background: Lung cancer is the most common malignancy in humans and its high fatality means that no effective treatment is available. Developing new therapeutic strategies for lung cancer is urgently needed. Malaria has been reported to stimulate host immune responses, which are believed to be efficacious for combating some clinical cancers. This study is aimed to provide evidence that malaria parasite infection is therapeutic for lung cancer.

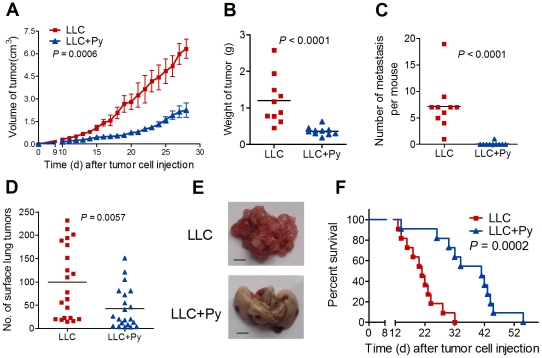
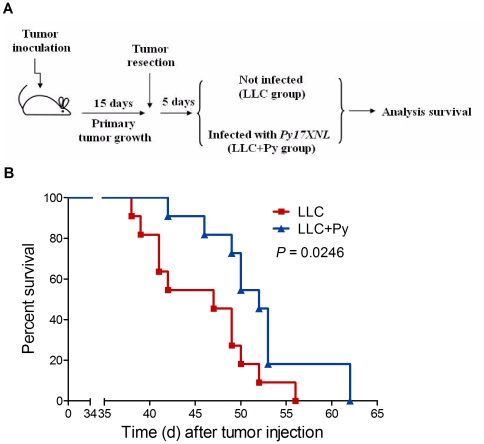
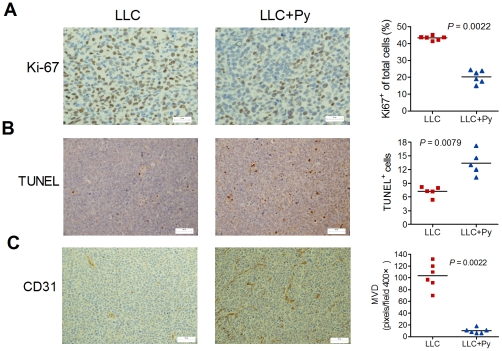
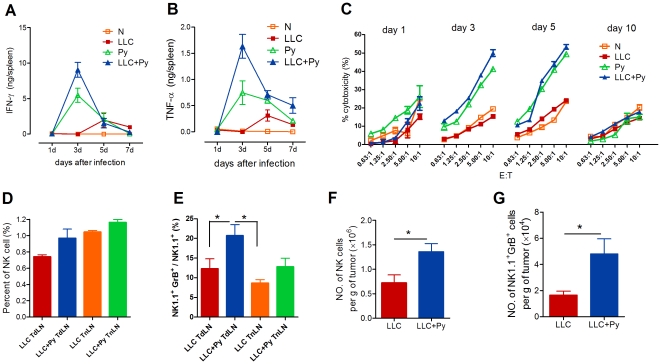
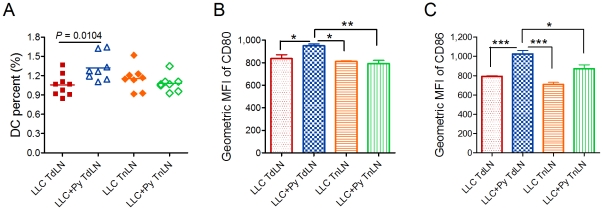
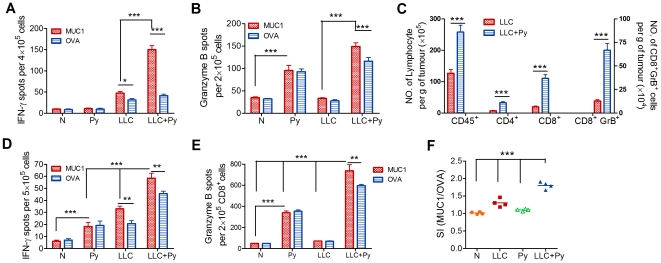
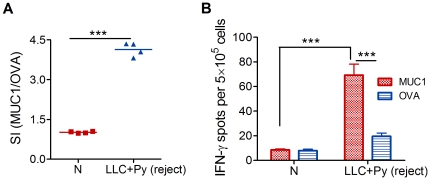
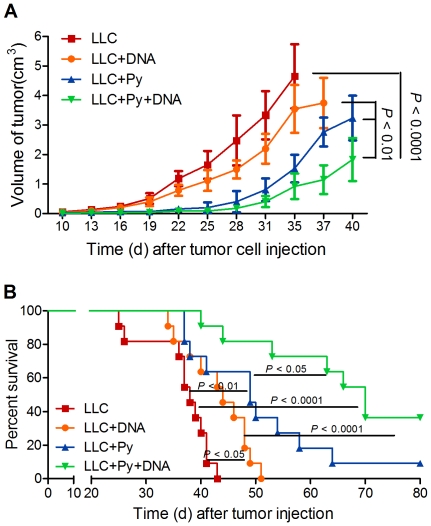
Methodology/principal findings: Antitumor effect of malaria infection was examined in both subcutaneously and intravenously implanted murine Lewis lung cancer (LLC) model. The results showed that malaria infection inhibited LLC growth and metastasis and prolonged the survival of tumor-bearing mice. Histological analysis of tumors from mice infected with malaria revealed that angiogenesis was inhibited, which correlated with increased terminal deoxynucleotidyl transferase-mediated (TUNEL) staining and decreased Ki-67 expression in tumors. Through natural killer (NK) cell cytotoxicity activity, cytokine assays, enzyme-linked immunospot assay, lymphocyte proliferation, and flow cytometry, we demonstrated that malaria infection provided anti-tumor effects by inducing both a potent anti-tumor innate immune response, including the secretion of IFN-γ and TNF-α and the activation of NK cells as well as adaptive anti-tumor immunity with increasing tumor-specific T-cell proliferation and cytolytic activity of CD8(+) T cells. Notably, tumor-bearing mice infected with the parasite developed long-lasting and effective tumor-specific immunity. Consequently, we found that malaria parasite infection could enhance the immune response of lung cancer DNA vaccine pcDNA3.1-hMUC1 and the combination produced a synergistic antitumor effect.

Conclusions/significance: Malaria infection significantly suppresses LLC growth via induction of innate and adaptive antitumor responses in a mouse model. These data suggest that the malaria parasite may provide a novel strategy or therapeutic vaccine vector for anti-lung cancer immune-based therapy.


Conflict of interest statement

Competing Interests: The authors have declared that no competing interests exist.

Figures

Figure 1
Figure 1. Malaria parasite infection suppresses tumor growth and metastasis in a mouse model.
A, Tumor growth was measured over time (n = 12). The graph shows average with SD. B, Tumor mass 17 days after tumor cell inoculation (n = 10). C, Metastasis development 35 days after tumor inoculation. The graph shows the number of lung and liver tumors in the LLC and LLC+Py mice (n = 10). D, Number of lung tumor nodules in mice 18 days after intravenous tumor inoculation (n = 21). E, Examples of metastatic nodules in the lungs of mice in D. F, Survival curve of LLC and LLC+Py group mice (n = 11). All experiments were performed three times with similar results. Statistical differences between groups are indicated by the P values.
Figure 2
Figure 2. The antimetastatic effect of malaria infection after tumor surgery in mice.
A, 5×10⁵ LLC cells were injected s.c. into the right flank of C57BL/6 mice. After 15 days of tumor growth, primary tumors were surgically removed. Mice were followed for an additional 5 days to recovery, then half of the mice were infected with P. yoelii 17XNL and the others were injected with an equivalent number of uninfected erythrocytes. B, Data shows the survival curves of mice after primary tumor removal. P. yoelii 17XNL infected mice survived much longer than their uninfected counterparts (n = 11).
Figure 3
Figure 3. Effect of malaria parasite infection on tumor cell proliferation, apoptosis, and angiogenesis.
AC, Immunohistochemical staining (left) and assay quantification (right, n = 5–6) for Ki-67 (A), TUNEL (B), and CD31 (C) analyses of the tumor samples in Fig. 1B. Each symbol corresponds to an individual animal. The line represents the mean value. Bars: 25 µm in A, 50 µm in B and C.
Figure 4
Figure 4. Malaria parasite infection induces the production of Th1-type cytokines and increases NK cell cytotoxicity activity.
A and B, Levels of IFN-γ (A) and TNF-α (B) in splenocyte culture supernatants as measured by ELISA (n = 4). C, The cytotoxicity of NK cells enriched from splenocytes at various time points was assessed against YAC-1 cells at the indicated effector-to-target (E∶T) ratios (n = 4). D and E, Five days after tumor inoculation, the percentage (D) and the granzyme B-secretion (E) of NK cells were determined in TdLN and TnLN of mice by flow cytometry (n = 6). F and G, The absolute numbers of tumor-infiltrating NK cells (F) and spontaneous granzyme B-producing NK cells (G) were quantified by flow cytometry and normalized to biopsy weight (n = 6) 17 days after tumor inoculation. These experiments were independently performed three times with identical results, and the representative scatter plots are shown. All graphs show average with SD. *, P<0.05.
Figure 5
Figure 5. Malaria infection increases the percentage and maturation of DC in TdLN.
Two days after tumor inoculation, DC maturation profile and numbers were determined in lymph node cells. A. Quantification of DC percentage in lymph nodes by flow cytometry. DC percentage in TdLNs and TnLN of tumor bearing mice are shown. The line in graph indicates the mean value. B and C, The geometric mean fluorescence intensity of CD80 (B) and CD86 (C) on DCs, data are pooled from three independent experiments. The graph shows average with SD. *P<0.05; ** P<0.01; *** P<0.001.
Figure 6
Figure 6. Malaria parasite infection induces anti-tumor-specific immune responses.
A and B, IFN-γ- (A) and granzyme B- (B) producing cells derived from TdLNs 17 days after tumor inoculation were assessed by ELISPOT assay (n = 6). C, The absolute numbers of tumor-infiltrating CD45+ cells, CD4+ and CD8+ T cells, and spontaneous granzyme B-producing CD8+ T cells were quantified by flow cytometry and normalized to biopsy weight (n = 6) 17 days after tumor inoculation. D to F, Splenocytes were harvested 30 days after tumor inoculation. D, IFN-γ production was measured using an ELISPOT assay (n = 6). E, CD8+ T cells were enriched from splenocytes and subjected to ELISPOT assay to measure granzyme B production (n = 6). F, Proliferation of splenocytes was measured by BrdU incorporation (n = 6). Data are presented as the stimulation index (SI), which was calculated by determining the ratio of specific MUC1 peptides to non-specific OVA peptides. All graphs show average with SD. These experiments were independently performed three times with identical results, and the representative scatter plots are shown. *, P<0.05; **, P<0.01; ***, P<0.001.
Figure 7
Figure 7. Malaria parasite infection stimulates effective long-lasting anti-tumor immunity.
A and B, P. yoelii 17XNL infection resulted in complete tumor regression in 5–10% (1–2 per 20 mice) of the infected tumor-bearing mice. Fifty days after infection, splenocytes from the mice exhibiting tumor regression were analyzed for MUC1-specific proliferation (A) and IFN-γ secretion (B) (n = 4). The line in A indicates the mean value. Bars in B represent SD. ***P<0.001.
Figure 8
Figure 8. Combination of malaria parasite infection and DNA vaccine treatment produces a synergy antitumor effect.
A and B, 5×10⁵ LLC-MUC1 cells were injected s.c. into the flank region of mice. Four groups (LLC, LLC+DNA, LLC+Py, and LLC+Py+DNA) of mice were immunized with DNA vaccine or infected with parasites as described in Materials and Methods and subsequently monitored for tumor development for 40 days (A) and determined the survival end point for 80 days (B). The graph of (A) shows average with SD. Statistical differences between groups are indicated by the P values.

Similar articles

Cited by

References

    1. Jemal A, Siegel R, Xu J. Cancer statistics, 2010. CA Cancer J Clin. 2010;60:277–300. - PubMed
    1. Gridelli C, Rossi A, Maione P, Ferrara ML, Castaldo V, et al. Vaccines for the treatment of non-small cell lung cancer: a renewed anticancer strategy. Oncologist. 2009;14:909–920. - PubMed
    1. Kakimi K, Nakajima J, Wada H. Active specific immunotherapy and cell-transfer therapy for the treatment of non-small cell lung cancer. Lung Cancer. 2009;65:1–8. - PubMed
    1. Kelly RJ, Gulley JL, Giaccone G. Targeting the immune system in non-small-cell lung cancer: bridging the gap between promising concept and therapeutic reality. Clin Lung Cancer. 2010;11:228–237. - PMC - PubMed
    1. Van den Heuvel MM, Burgers SA, van Zandwijk N. Immunotherapy in non-small-cell lung carcinoma: from inflammation to vaccination. Clin Lung Cancer. 2009;10:99–105. - PubMed

Publication types

MeSH terms