. 2011;6(9):e24595.
doi: 10.1371/journal.pone.0024595. Epub 2011 Sep 13.

Suppression of breast tumor growth and metastasis by an engineered transcription factor

Affiliations

Suppression of breast tumor growth and metastasis by an engineered transcription factor

Adriana S Beltran et al. PLoS One. 2011.

Abstract

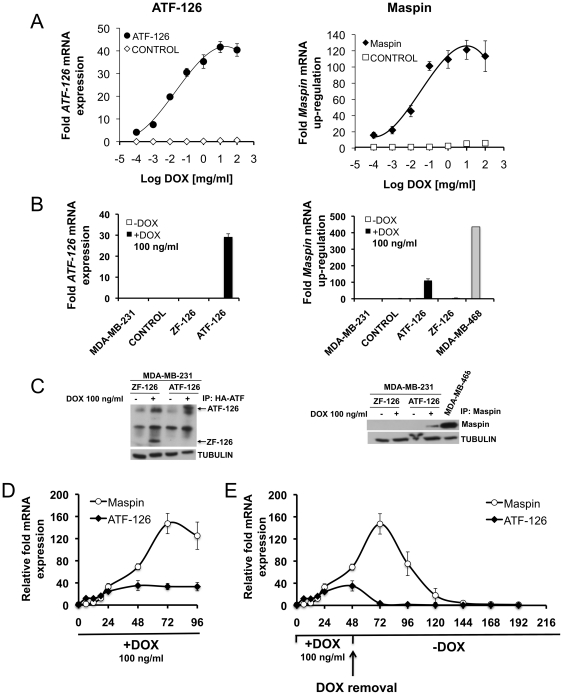
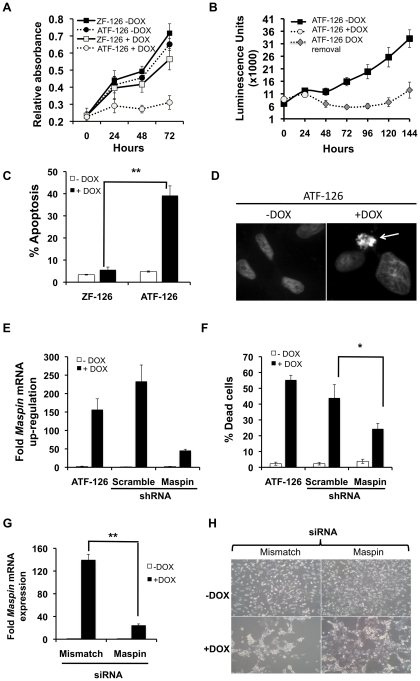
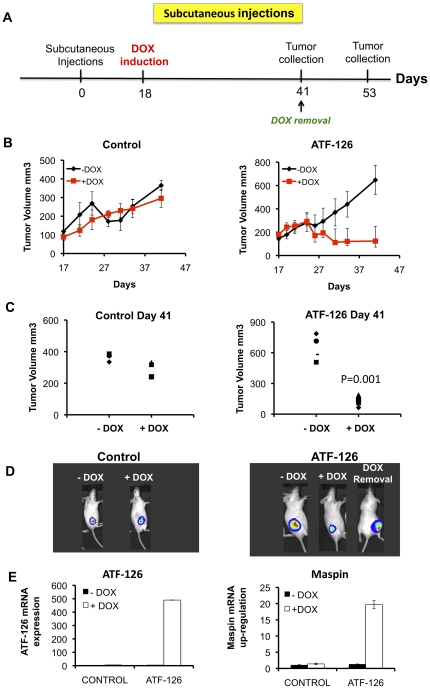
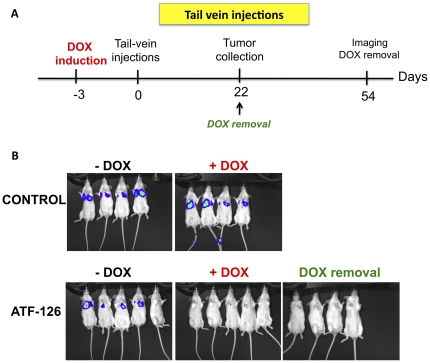
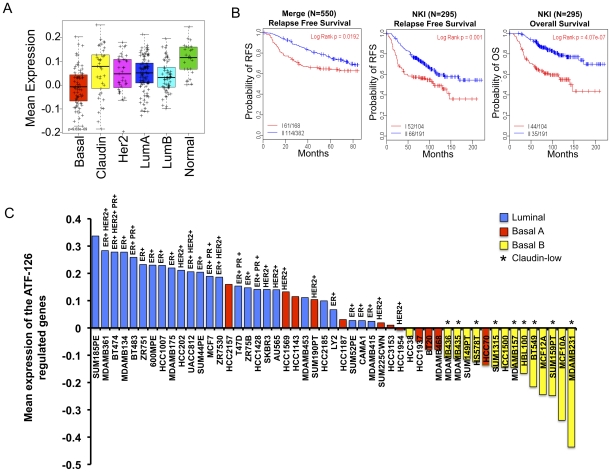
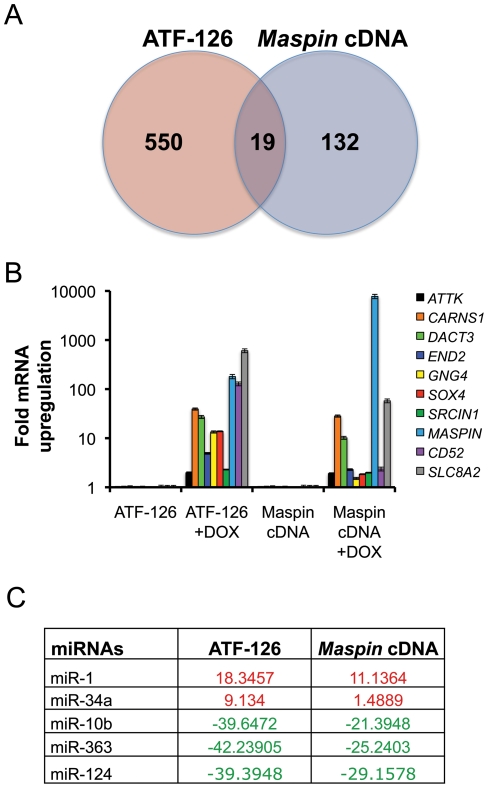
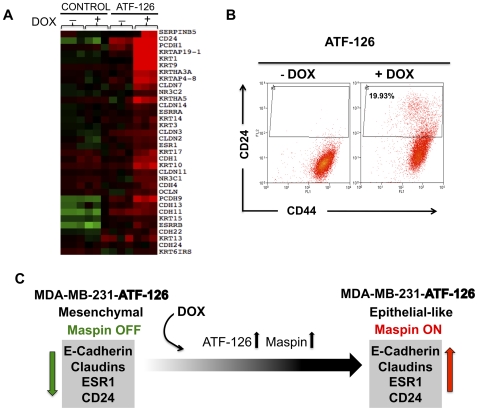
Maspin is a tumor and metastasis suppressor playing an essential role as gatekeeper of tumor progression. It is highly expressed in epithelial cells but is silenced in the onset of metastatic disease by epigenetic mechanisms. Reprogramming of Maspin epigenetic silencing offers a therapeutic potential to lock metastatic progression. Herein we have investigated the ability of the Artificial Transcription Factor 126 (ATF-126) designed to upregulate the Maspin promoter to inhibit tumor progression in pre-established breast tumors in immunodeficient mice. ATF-126 was transduced in the aggressive, mesenchymal-like and triple negative breast cancer line, MDA-MB-231. Induction of ATF expression in vivo by Doxycycline resulted in 50% reduction in tumor growth and totally abolished tumor cell colonization. Genome-wide transcriptional profiles of ATF-induced cells revealed a gene signature that was found over-represented in estrogen receptor positive (ER+) "Normal-like" intrinsic subtype of breast cancer and in poorly aggressive, ER+ luminal A breast cancer cell lines. The comparison transcriptional profiles of ATF-126 and Maspin cDNA defined an overlapping 19-gene signature, comprising novel targets downstream the Maspin signaling cascade. Our data suggest that Maspin up-regulates downstream tumor and metastasis suppressor genes that are silenced in breast cancers, and are normally expressed in the neural system, including CARNS1, SLC8A2 and DACT3. In addition, ATF-126 and Maspin cDNA induction led to the re-activation of tumor suppressive miRNAs also expressed in neural cells, such as miR-1 and miR-34, and to the down-regulation of potential oncogenic miRNAs, such as miR-10b, miR-124, and miR-363. As expected from its over-representation in ER+ tumors, the ATF-126-gene signature predicted favorable prognosis for breast cancer patients. Our results describe for the first time an ATF able to reduce tumor growth and metastatic colonization by epigenetic reactivation of a dormant, normal-like, and more differentiated gene program.


Conflict of interest statement

Competing Interests: The authors have declared that no competing interests exist.

Figures

Figure 1
Figure 1. Induction of ATF-126 by DOX results in reactivation of the target gene Maspin.
A. Dose-response plot monitoring ATF-126 (left panel) and Maspin (right panel) mRNA levels upon treatment with increasing concentrations of DOX. CONTROL and ATF-126 cells were treated for 72 hours and mRNA was measured by quantitative real-time PCR (qRT-PCR). B–C. ATF-126 and Maspin mRNA expression levels by qRT-PCR (B) and western blot (C) induced with 100 ng/ml of DOX. MDA-MB-468 is a poorly aggressive ER- breast cancer cell line expressing endogenous Maspin as a reference control . D. Time course kinetics of ATF-126 and Maspin mRNA levels by qRT-PCR upon DOX treatment. ATF-126 cells were induced with DOX and collected at 0, 6, 12, 18, 24, 48, 72 and 96 hours. E. Time course kinetics of ATF-126 and Maspin expression levels by qRT-PCR upon DOX treatment and removal. ATF-126 cells were induced with DOX for 48 hours, then DOX was removed from the media and cells were maintained in DOX-free media for an additional 168 hours. Gene expression levels were normalized to the −DOX cells. Data represents the mean ± SD of three independent biological replicates. MDA-MB-231-LUC are un-transduced cells; CONTROL, cells transduced with an empty vector; ATF-126, a full length ATF containing the 6 ZF DNA-binding domains and VP64 activator domain; ZF-126, a truncated or inactive ATF-126 lacking the VP64 activator domain.
Figure 2
Figure 2. ATF-126 induced apoptosis upon DOX treatment.
A. Cell viability plot of ATF-126 and ZF-126 cells treated with vehicle (−DOX) or DOX (+DOX) for 72 hours. ATF-126 refers to a full length, active ATF and ZF-126 is a truncated, transcriptionally inactive construct lacking the VP64 activator domain. B. Cell viability plot of ATF-126 transduced cells after DOX removal. Cells were induced with DOX for 48 hours (open circles). DOX was removed from the media and cells were kept in DOX-free media for an additional period of 96 hours. Viability of ATF-126 cells growing in absence of DOX (−DOX, filled squares) was plotted as reference control. Cell viability was measured with an XTT assay . C. ATF-126 induced apoptosis upon DOX treatment. Either ATF-126 or ZF-126 cells were kept in vehicle-treated media (−DOX) or DOX (+DOX) and collected at 72 hours after induction. The percentage of apoptosis was quantitatively analyzed using an Annexin-V staining . D. Hoechst staining of ATF-126 −DOX and +DOX cells at 72 hours post-induction. Arrow points to a positive apoptotic cell, showing nuclear condensation. E. Expression of Maspin by qRT-PCR in ATF-126 cells retrovirally transduced with either a scramble or with a Maspin-specific shRNA construct. F. Percentage of cell death by trypan-blue exclusion assay in ATF-126 cells transduced with either a scramble or a Maspin-specific shRNA. G. Maspin expression as assessed by qRT-PCR in ATF-126 cells transfected with either a mismatch or a Maspin-specific siRNA, and treated with vehicle (−DOX) or DOX (+DOX). H. Representative pictures of the Maspin siRNA knock-down experiments of cells treated with vehicle (−DOX) or DOX (+DOX). Bar graphs in C, E, F and G represent the average of 3 independent experiments. Differences between samples were calculated with a student t test with level of significance *p≤0.05 and ** p≤0.01.
Figure 3
Figure 3. ATF-126 induced tumor suppression in SCID mice.
A. Time-line of the experiments involving subcutaneous tumor injections illustrating the time of injection of tumor cells, induction and removal of DOX, and tumor collection. B. Time course plots monitoring tumor volumes of CONTROL and ATF-126 groups, N = 8 animals per group. Four animals per group were maintained in DOX-free diet (−DOX), whereas the other half was treated with DOX (+DOX). The tumor growth was measured by caliper the day before induction (day 17) until tumor collection (day 41). C. Tumor volume measurements at the day of tumor collection for both CONTROL (left panel) and ATF-126 animals (right panel). Differences in tumor growth were calculated with a student t test (***p = 0.001). D. Representative bioluminescence images comparing signal intensities of luciferase photon counts from the subcutaneous growths at day 41 for CONTROL (left) and ATF-126 animals (right), treated in absence (−DOX) and presence (+DOX) of DOX. “DOX removal” indicates an ATF-126-injected animal previously induced with DOX, subsequently removed from DOX (day 41), and imaged at day 53 (right). E. ATF-126 and Maspin expression levels by qRT-PCR in tumor samples collected at day 41 from both, CONTROL and ATF-126 animals.
Figure 4
Figure 4. ATF-126 inhibits breast tumor cell colonization in the lungs.
A. Time-line of the tail-vein injections experiments, indicating the times of the DOX induction and removal, and tumor collection. B. Bioluminescence images of CONTROL and ATF-126 mice groups maintained in DOX-free (−DOX, left panel) and DOX containing diet (+DOX, right panel). Mice were injected via tail-vein with either CONTROL or ATF-126 cells and imaged every week to assess lung colonization. Images shown were taken at day 22 after injection of the tumor cells. DOX removal indicates ATF-126 animals previously induced by DOX and next placed in DOX-free diet.
Figure 5
Figure 5. ATF-126 up-regulates a gene signature over-represented in Normal-Like breast cancers.
A. Box-and-whisker plot for the mean expression of the 550 up-regulated gene signature (Table S1) This signature represents the number of genes significantly up-regulated in ATF-126 cells exposed to DOX for 72 hours relative to the same cells in absence of DOX. The prevalence of this signature was evaluated across the intrinsic molecular subtypes of breast cancers using the previously published UNC breast cancer patient database (UNC337). P values were calculated by comparing gene expression means across all breast tumor subtypes. B. Kaplan–Meier survival estimates of relapse-free survival for the Merge 550 database (left panel), relapse-free survival and overall survival for the NKI 295 database (center and right panel, respectively). Patients were stratified into group I (red curves) and group II (blue curves) based on 2-way hierarchy clusters. P-values were obtained from the log-rank test. C. Mean expression analysis of the ATF-126 gene signature across breast cancer cell lines , showing the expression status of estrogen receptor (ER), Human Epidermal growth factor Receptor 2 (HER2) and progesterone receptor (PR).
Figure 6
Figure 6. ATF-126 and Maspin cDNA co-regulated targets.
A. Venn diagram indicating the intersecting up-regulated genes between the ATF-126 and the Maspin cDNA groups in DOX induced cells. B. Gene expression analyses of nine differentially up-regulated genes. The ATF-126 and Maspin cDNA stable cell lines were treated with either vehicle (−DOX) or DOX (+DOX) for a period of 72 hrs, and differences in expression quantified by qRT-PCR. Data was normalized to the −DOX cells, and represent an average of three independent experiments. C. Common MicroRNAs differentially regulated in the ATF-126 and the Maspin cDNA cell lines, as assessed by qRT-PCR. Data was normalized to the −DOX cells. Up-regulated miRNAs are indicated in red, and down-regulated miRNAs in green.
Figure 7
Figure 7. ATF-126 regulates markers associated with decreased tumorigenicity and metastasis.
A. Microarray expression analysis of selected epithelial markers in CONTROL and ATF-126 cells, in presence or absence of DOX. Cells were collected 72 hours after DOX induction. Arrays were performed in triplicate with three different biological replicates using Agilent 44 k arrays. The Array tree was derived from an unsupervised hierarchical clustering and the gene list is shown in Table S1. Each colored square on the upper right represents the relative mean transcript abundance (in log2 space) with highest expression being red, average expression being black, and lowest expression being green. B. Induction of ATF-126 by DOX modifies the tumor initiating cell signature CD44+CD24. Representative flow cytometric analysis of CD44 and CD24 expression levels in ATF-126 −DOX and +DOX cells collected 72 hours after treatment. The forward scatter (FCS) channel was plotted in y-axis and the fluorescence of the cell surface antigens in the x-axis. The gate in the +DOX panel illustrates the generation of a novel CD24+ population upon induction of ATF-126. C. A model illustrating a potential mechanism by which ATF-126 could reprogram a mesenchymal, Claudin-low MDA-MB-231 cell line towards a more epithelial-like phenotype.

Similar articles

Cited by

References

    1. Sager R, Sheng S, Pemberton P, Hendrix MJ. Maspin. A tumor suppressing serpin. Adv Exp Med Biol. 1997;425:77–88. - PubMed
    1. Cher ML, Biliran HR, Jr, Bhagat S, Meng Y, Che M, et al. Maspin expression inhibits osteolysis, tumor growth, and angiogenesis in a model of prostate cancer bone metastasis. Proc Natl Acad Sci U S A. 2003;100:7847–7852. - PMC - PubMed
    1. Zhang M, Volpert O, Shi YH, Bouck N. Maspin is an angiogenesis inhibitor. Nat Med. 2000;6:196–199. - PubMed
    1. Nakagawa M, Katakura H, Adachi M, Takenaka K, Yanagihara K, et al. Maspin expression and its clinical significance in non-small cell lung cancer. Ann Surg Oncol. 2006;13:1517–1523. - PubMed
    1. Machtens S, Serth J, Bokemeyer C, Bathke W, Minssen A, et al. Expression of the p53 and Maspin protein in primary prostate cancer: correlation with clinical features. Int J Cancer. 2001;95:337–342. - PubMed

Publication types