

Epstein-Barr virus-induced gene 3 (EBI3): a novel diagnosis marker in Burkitt lymphoma and diffuse large B-cell lymphoma
- PMID: 21931777
- PMCID: PMC3169615
- DOI: 10.1371/journal.pone.0024617
Epstein-Barr virus-induced gene 3 (EBI3): a novel diagnosis marker in Burkitt lymphoma and diffuse large B-cell lymphoma
Abstract
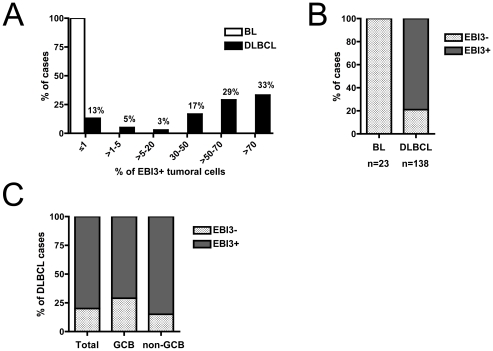
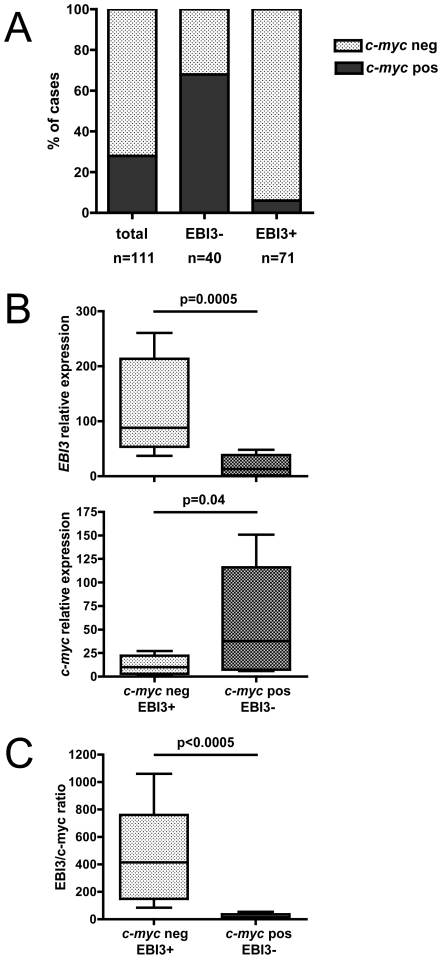
The distinction between Burkitt lymphoma (BL) and diffuse large B-cell lymphoma (DLBCL), two types of mature aggressive B-cell lymphomas that require distinct treatments, can be difficult because of forms showing features intermediate between DLBCL and BL (here called BL/DLBCL). They can be discriminated by the presence of c-myc translocations characteristic of BL. However, these are not exclusive of BL and when present in DLBCL are associated with lower survival. In this study, we show that Epstein-Barr virus-induced gene 3 (EBI3) is differentially expressed among BL and DLBCL. Analysis of gene expression data from 502 cases of aggressive mature B-cell lymphomas available on Gene Expression Omnibus and immunohistochemical analysis of 184 cases of BL, BL/DLBCL or DLBCL, showed that EBI3 was not expressed in EBV-positive or -negative BL cases, whereas it was expressed by over 30% of tumoral cells in nearly 80% of DLBCL cases, independently of their subtypes. In addition, we show that c-myc overexpression represses EBI3 expression, and that DLBCL or BL/DLBCL cases with c-myc translocations have lower expression of EBI3. Thus, EBI3 immunohistochemistry could be useful to discriminate BL from DLBCL, and to identify cases of BL/DLBCL or DLBCL with potential c-myc translocations.
Conflict of interest statement
Figures


Similar articles
-
Diagnostic utility of lymphocyte enhancer factor 1 in aggressive B-cell lymphoma with MYC rearrangement.Am J Clin Pathol. 2025 Jun 3;163(6):815-821. doi: 10.1093/ajcp/aqae189. Am J Clin Pathol. 2025. PMID: 39912808
-
Identification of ADGRE5 as discriminating MYC target between Burkitt lymphoma and diffuse large B-cell lymphoma.BMC Cancer. 2019 Apr 5;19(1):322. doi: 10.1186/s12885-019-5537-0. BMC Cancer. 2019. PMID: 30953469 Free PMC article.
-
[Clinicopathologic and immunohistochemical study of intra-abdominal non-Hodgkin B-cell lymphoma occurring in children].Zhonghua Bing Li Xue Za Zhi. 2009 Nov;38(11):759-64. Zhonghua Bing Li Xue Za Zhi. 2009. PMID: 20079016 Chinese.
-
Burkitt lymphoma versus diffuse large B-cell lymphoma: a practical approach.Hematol Oncol. 2010 Jun;28(2):53-6. doi: 10.1002/hon.916. Hematol Oncol. 2010. PMID: 19844983 Review.
-
Diagnosis of Burkitt Lymphoma and Related High-Grade B-Cell Neoplasms.Surg Pathol Clin. 2010 Dec;3(4):1035-59. doi: 10.1016/j.path.2010.09.010. Epub 2010 Nov 27. Surg Pathol Clin. 2010. PMID: 26839298 Review.
Cited by
-
Regulation of the Immune Checkpoint Indoleamine 2,3-Dioxygenase Expression by Epstein-Barr Virus.Biomolecules. 2021 Nov 30;11(12):1792. doi: 10.3390/biom11121792. Biomolecules. 2021. PMID: 34944437 Free PMC article. Review.
-
Expression of IL-27 by tumor cells in invasive cutaneous and metastatic melanomas [corrected].PLoS One. 2013 Oct 10;8(10):e75694. doi: 10.1371/journal.pone.0075694. eCollection 2013. PLoS One. 2013. PMID: 24130734 Free PMC article.
-
Potential clinical application of interleukin-27 as an antitumor agent.Cancer Sci. 2015 Sep;106(9):1103-10. doi: 10.1111/cas.12731. Epub 2015 Aug 6. Cancer Sci. 2015. PMID: 26132605 Free PMC article. Review.
-
Interleukin-35 Limits Anti-Tumor Immunity.Immunity. 2016 Feb 16;44(2):316-29. doi: 10.1016/j.immuni.2016.01.013. Epub 2016 Feb 9. Immunity. 2016. PMID: 26872697 Free PMC article.
-
Tumor-derived IL-35 promotes tumor growth by enhancing myeloid cell accumulation and angiogenesis.J Immunol. 2013 Mar 1;190(5):2415-23. doi: 10.4049/jimmunol.1202535. Epub 2013 Jan 23. J Immunol. 2013. PMID: 23345334 Free PMC article.
References
-
- Blum KA, Lozanski G, Byrd JC. Adult Burkitt leukemia and lymphoma. Blood. 2004;104:3009–3020. - PubMed
-
- Armitage JO. How I treat patients with diffuse large B-cell lymphoma. Blood. 2007;110:29–36. - PubMed
-
- Coiffier B, Lepage E, Briere J, Herbrecht R, Tilly H, et al. CHOP chemotherapy plus rituximab compared with CHOP alone in elderly patients with diffuse large-B-cell lymphoma. N Engl J Med. 2002;346:235–242. - PubMed
-
- Pfreundschuh M, Trümper L, Osterborg A, Pettengell R, Trneny M, et al. CHOP-like chemotherapy plus rituximab versus CHOP-like chemotherapy alone in young patients with good-prognosis diffuse large-B-cell lymphoma: a randomised controlled trial by the MabThera International Trial (MInT) Group. Lancet Oncol. 2006;7:379–391. - PubMed
Publication types
MeSH terms
Substances
LinkOut - more resources
Full Text Sources
