. 2011;6(9):e24665.
doi: 10.1371/journal.pone.0024665. Epub 2011 Sep 9.

Acquisition of chemoresistance in gliomas is associated with increased mitochondrial coupling and decreased ROS production

Affiliations

Acquisition of chemoresistance in gliomas is associated with increased mitochondrial coupling and decreased ROS production

Claudia R Oliva et al. PLoS One. 2011.

Abstract

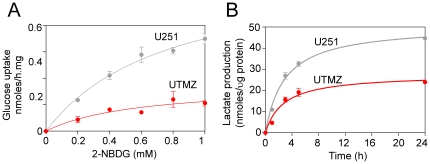
Temozolomide (TMZ) is an alkylating agent used for treating gliomas. Chemoresistance is a severe limitation to TMZ therapy; there is a critical need to understand the underlying mechanisms that determine tumor response to TMZ. We recently reported that chemoresistance to TMZ is related to a remodeling of the entire electron transport chain, with significant increases in the activity of complexes II/III and cytochrome c oxidase (CcO). Moreover, pharmacologic and genetic manipulation of CcO reverses chemoresistance. Therefore, to test the hypothesis that TMZ-resistance arises from tighter mitochondrial coupling and decreased production of reactive oxygen species (ROS), we have assessed mitochondrial function in TMZ-sensitive and -resistant glioma cells, and in TMZ-resistant glioblastoma multiform (GBM) xenograft lines (xenolines). Maximum ADP-stimulated (state 3) rates of mitochondrial oxygen consumption were greater in TMZ-resistant cells and xenolines, and basal respiration (state 2), proton leak (state 4), and mitochondrial ROS production were significantly lower in TMZ-resistant cells. Furthermore, TMZ-resistant cells consumed less glucose and produced less lactic acid. Chemoresistant cells were insensitive to the oxidative stress induced by TMZ and hydrogen peroxide challenges, but treatment with the oxidant L-buthionine-S,R-sulfoximine increased TMZ-dependent ROS generation and reversed chemoresistance. Importantly, treatment with the antioxidant N-acetyl-cysteine inhibited TMZ-dependent ROS generation in chemosensitive cells, preventing TMZ toxicity. Finally, we found that mitochondrial DNA-depleted cells (ρ°) were resistant to TMZ and had lower intracellular ROS levels after TMZ exposure compared with parental cells. Repopulation of ρ° cells with mitochondria restored ROS production and sensitivity to TMZ. Taken together, our results indicate that chemoresistance to TMZ is linked to tighter mitochondrial coupling and low ROS production, and suggest a novel mitochondrial ROS-dependent mechanism underlying TMZ-chemoresistance in glioma. Thus, perturbation of mitochondrial functions and changes in redox status might constitute a novel strategy for sensitizing glioma cells to therapeutic approaches.


Conflict of interest statement

Competing Interests: The authors have declared that no competing interests exist.

Figures

Figure 1
Figure 1. TMZ-resistant cells show a higher mitochondrial coupling.
Oxygen consumption rates of isolated mitochondria (200 µg) were determined using a respirometer. Graphic illustrations of sample traces of mitochondrial respiration rates of (A) U251 and (B) UTMZ cells (dotted line, oxygen concentration; solid line, oxygen consumption). (C) Kinetic characterization of glutamate/malate-dependent respiration of isolated mitochondria from U251 and UTMZ cells. (D) Kinetic characterization of glutamate/malate-dependent respiration of isolated mitochondria from TMZ-sensitive and resistant GBM xenolines. Data are expressed as means ± S.E. of three independent experiments. p<0.05 (*), p<0.01 (**) and p<0.001 (***).
Figure 2
Figure 2. Glucose uptake and lactate production in U251-MG and UTMZ cells.
(A) Dose-response analyses of glucose uptake. (B) Time course of lactate production. Data are shown as the means ± S.E. of two independent experiments performed in triplicate.
Figure 3
Figure 3. Determination of mitochondrial superoxide production.
ROS production was estimated by oxidation of the fluorescent probe, MitoSox in TMZ-sensitive (U251) and TMZ-resistant (UTMZ) cells after 2 h of treatment with vehicle (control), H2O2 (100 µM) or TMZ (300 µM). (A) Representative histograms of flow cytometric analysis of MitoSox fluorescence. (B) Columns represent the MitoSox-mean fluorescence. Data are expressed as means ± S.E. of three independent experiments. p<0.05 (*). (C) Representative images acquired with epifluorescence microscopy showing co-localization of Mito Tracker Green and MitoSox fluorescence in U251 (Top panel) and UTMZ cells (Bottom panel).
Figure 4
Figure 4. Determination of total ROS production.
ROS production was estimated by oxidation of the fluorescent probe, CM-CFDA in TMZ-sensitive (U251) and TMZ-resistant (UTMZ) cells after 2 h of treatment with vehicle (control), H2O2 (100 µM) or TMZ (300 µM). (A) Representative histograms of flow cytometric analysis of MitoSox fluorescence. (B) Columns represent the CM-CFDA-mean fluorescence. Data are expressed as means ± S.E. of three independent experiments. p<0.001 (***).
Figure 5
Figure 5. Determination of GSH/GSSG ratio, lipid peroxidation and AP sites generation.
(A) GSH/GSSG ratio in U251 and UTMZ cells under control conditions or after treatment with 100 µM H2O2 for 1 h. (B) Generation of AP sites in mitochondrial DNA from U251 and UTMZ cells treated for 1 h with 100 µM H2O2. Columns represent the number of AP sites relative to the control. Data are expressed as means ± S.E. of three independent experiments. (C,D) Effect of H2O2 and TMZ on cardiolipin oxidation. (C) Representative histograms of flow cytometric analysis of NAO fluorescence, (D) Columns represent the NAO-mean fluorescence. Data are expressed as means ± S.E. of three independent experiments. p<0.05 (*), p<0.01 (**) and p<0.001 (***). (E) Representative images acquired with epifluorescence microscopy showing co-localization of Mito Tracker Red and NAO fluorescence in U251 (Top panel) and UTMZ cells (Bottom panel).
Figure 6
Figure 6. Determination of ROS production and apoptosis in cellular models of mitochondrial dysfunction.
ROS production was estimated by oxidation of the fluorescent probes MitoSox in U251, U251-ρ° and U251-ρ° cybrid cells, and in COX-IV-1-shRNA transfected versus control, empty vector-transfected UTMZ cells (pLKO.1), in control vehicle-treated (control) cells or after 2 h of treatment with TMZ (300 µM). (A) Columns represent the MitoSox-mean fluorescence. (B) Quantification of apoptosis activation in different cellular models of mitochondrial dysfunction 72 h after treatment with TMZ (300 µM). Columns represent the average from triplicate determinations of the percentage of apoptotic cells. Data are expressed as means ± S.E. for three independent experiments. p<0.05 (*), p<0.01 (**) and p<0.001 (***).
Figure 7
Figure 7. Effect of NAC and BSO on ROS production and TMZ-dependent apoptosis.
(A) U251 and (B) UTMZ cells were treated with NAC (5 mM) or BSO (5 mM) for 24 h. Apoptotic cells were examined by Annexin V/Pi staining. Columns represent the average from triplicate determinations of the percentage of apoptotic cells. Data are presented as mean ± S.E. (n = 3). p<0.05 (*), p<0.01 (**) and p<0.001 (***)).
Figure 8
Figure 8. Mitochondrial regulation of chemosensitive and chemoresistance in glioma cells.
(A) Glycolytic cells with functional OxPhos (Warburg effect) and high mtROS. (B) Exclusively glycolytic cells (Pasteur effect) and no mtROS production. (C) OxPhos cells with tight coupling and low mtROS.

Similar articles

Cited by

References

    1. Saybasili H, Yuksel M, Haklar G, Yalcin AS. Effect of mitochondrial electron transport chain inhibitors on superoxide radical generation in rat hippocampal and striatal slices. Antioxid Redox Signal. 2001;3:1099–1104. - PubMed
    1. Staniek K, Gille L, Kozlov AV, Nohl H. Mitochondrial superoxide radical formation is controlled by electron bifurcation to the high and low potential pathways. Free Radic Res. 2002;36:381–387. - PubMed
    1. Boveris A, Chance B. The mitochondrial generation of hydrogen peroxide. General properties and effect of hyperbaric oxygen. Biochem J. 1973;134:707–716. - PMC - PubMed
    1. Richter C, Gogvadze V, Laffranchi R, Schlapbach R, Schweizer M, et al. Oxidants in mitochondria: from physiology to diseases. Biochim Biophys Acta. 1995;1271:67–74. - PubMed
    1. Trachootham D, Zhou Y, Zhang H, Demizu Y, Chen Z, et al. Selective killing of oncogenically transformed cells through a ROS-mediated mechanism by beta-phenylethyl isothiocyanate. Cancer Cell. 2006;10:241–252. - PubMed

Publication types

MeSH terms