. 2011;6(9):e24688.
doi: 10.1371/journal.pone.0024688. Epub 2011 Sep 13.

RLIP76, a glutathione-conjugate transporter, plays a major role in the pathogenesis of metabolic syndrome

Affiliations

RLIP76, a glutathione-conjugate transporter, plays a major role in the pathogenesis of metabolic syndrome

Jyotsana Singhal et al. PLoS One. 2011.

Abstract

Purpose: Characteristic hypoglycemia, hypotriglyceridemia, hypocholesterolemia, lower body mass, and fat as well as pronounced insulin-sensitivity of RLIP76⁻/⁻ mice suggested to us the possibility that elevation of RLIP76 in response to stress could itself elicit metabolic syndrome (MSy). Indeed, if it were required for MSy, drugs used to treat MSy should have no effect on RLIP76⁻/⁻ mice.

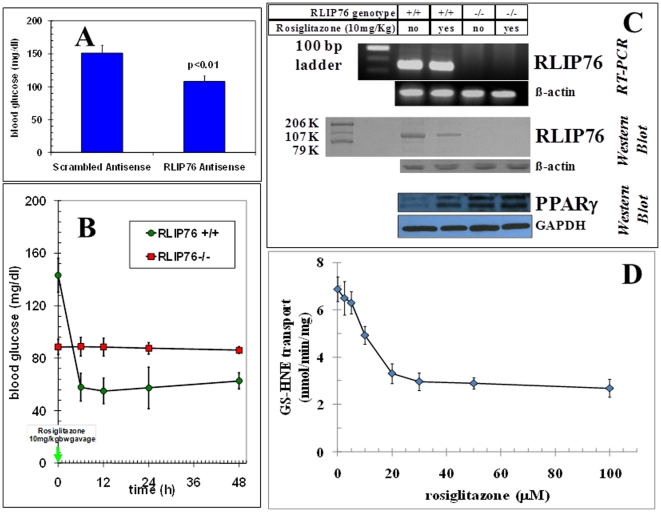
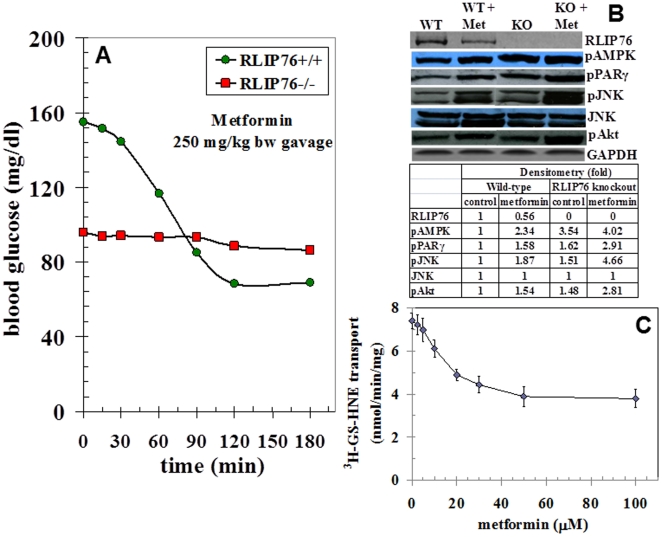
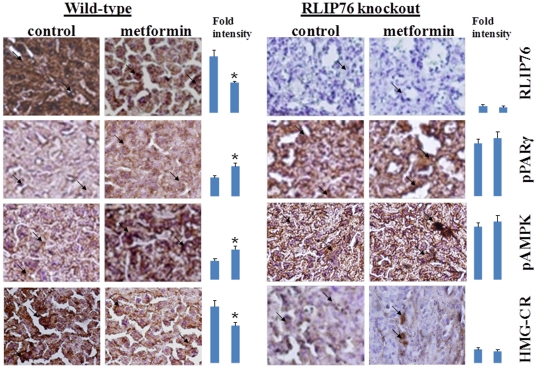
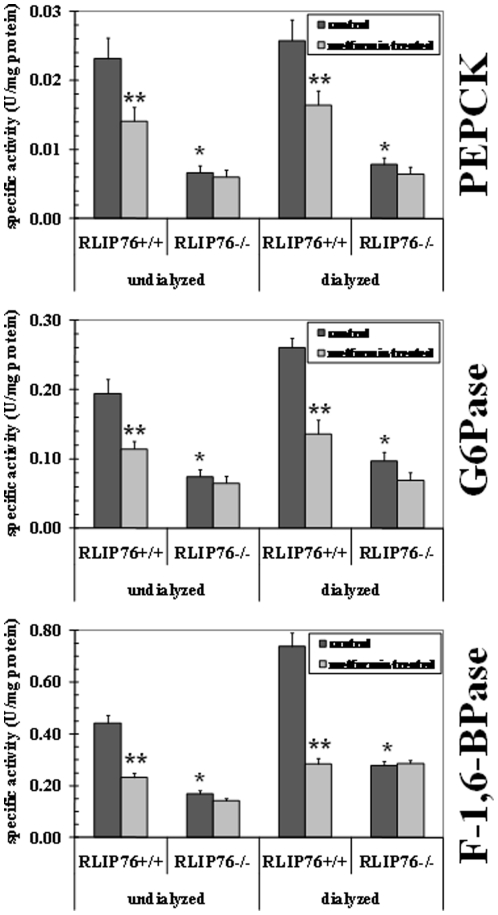
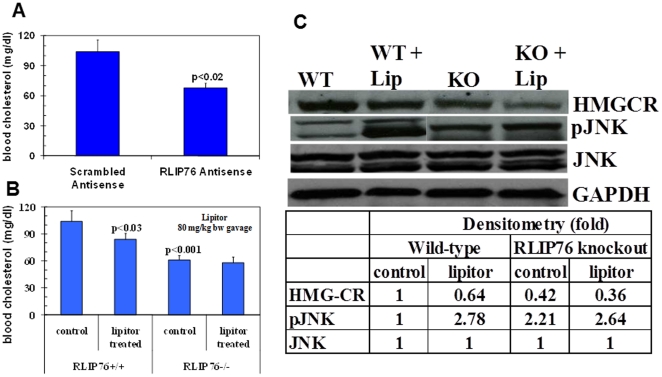
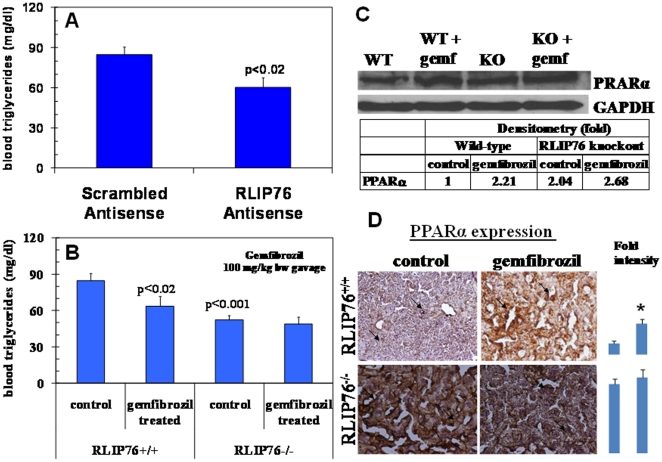
Research design and methods: Blood glucose (BG) and lipid measurements were performed in RLIP76⁺/⁺ and RLIP76⁻/⁻ mice, using Ascensia Elite Glucometer® for glucose and ID Labs kits for cholesterol and triglycerides assays. The ultimate effectors of gluconeogenesis are the three enzymes: PEPCK, F-1,6-BPase, and G6Pase, and their expression is regulated by PPARγ and AMPK. The activity of these enzymes was tested by protocols standardized by us. Expressions of RLIP76, PPARα, PPARγ, HMGCR, pJNK, pAkt, and AMPK were performed by Western-blot and tissue staining.

Results: The concomitant activation of AMPK and PPARγ by inhibiting transport activity of RLIP76, despite inhibited activity of key glucocorticoid-regulated hepatic gluconeogenic enzymes like PEPCK, G6Pase and F-1,6-BP in RLIP76⁻/⁻ mice, is a salient finding of our studies. The decrease in RLIP76 protein expression by rosiglitazone and metformin is associated with an up-regulation of PPARγ and AMPK.

Conclusions/significance: All four drugs, rosiglitazone, metformin, gemfibrozil and atorvastatin failed to affect glucose and lipid metabolism in RLIP76⁻/⁻ mice. Studies confirmed a model in which RLIP76 plays a central role in the pathogenesis of MSy and RLIP76 loss causes profound and global alterations of MSy signaling functions. RLIP76 is a novel target for single-molecule therapeutics for metabolic syndrome.


Conflict of interest statement

Competing Interests: The authors have declared that no competing interests exist.

Figures

Figure 1
Figure 1. Differential effect of rosiglitazone in RLIP76+/+ vs. RLIP76−/− mice.
Panel A: Effect of RLIP76 depletion by RLIP76 antisense on BG in RLIP76+/+ mice. p<0.01, when compared to scrambled antisense treatment. Panel B: BG was measured prior to and after a single oral dose of rosiglitazone (10 mg/kg b.w.) by gavage at various time points. p<0.001, when compared between RLIP76+/+ and RLIP76−/− mice, and rosiglitazone treatment in RLIP76+/+ mice. Panel C: Effect of rosiglitazone on RLIP76 expression (by QRT-PCR), RLIP76 protein content, and PPARγ protein content (by Western blot) in mouse liver tissue lysates. GAPDH expression was used as loading control. Panel D: Inhibition of the transport activity of purified recombinant human RLIP76 towards physiological substrate 3H-GSHNE by rosiglitazone. In panels A & B, 5 mice per group were used. These experiments were repeated three times and similar results were obtained.
Figure 2
Figure 2. Differential effect of metformin in RLIP76+/+ and RLIP76−/− mice.
Panel A: BG was measured prior to and after a single oral dose of metformin (250 mg/kg b.w.) by gavage at various time points (n = 6 mice/group). p<0.001, when compared between RLIP76+/+ and RLIP76−/− mice, and metformin treatment in RLIP76+/+ mice. Panel B: Effect of metformin on RLIP76, pAkt, pJNK, PPARγ, and pAMPK expression by Western blot in RLIP76+/+ and RLIP76−/− control and metformin treated mouse liver tissue lysates, and developed bands were quantified by scanning densitometry. GAPDH expression was used as loading control. Panel C: Inhibition of the transport activity of purified rec-RLIP76 towards 3H-GSHNE by metformin. The experiment was repeated twice and similar results were obtained. WT, wild-type (RLIP76+/+); KO, RLIP76-knockout (RLIP76−/−); Met, metformin.
Figure 3
Figure 3. Effect of metformin on RLIP76, PPARγ, AMPK, and HMGCR expression in paraffin embedded RLIP76+/+ and RLIP76−/− mouse liver tissues section by immuno-histochemistry using ABC staining kit (Vector).
Immuno-reactivity is evident as a dark brown stain, whereas non-reactive areas display only the background color. Sections were counter-stained with Hematoxylin (blue). Photographs at 40× magnification were acquired using Olympus Provis AX70 microscope. Percent staining was determined by measuring positive immuno-reactivity per unit area. Arrows represent the area for positive staining for an antigen. The intensity of antigen staining was quantified by digital image analysis. Bars represent mean ± S.E. (n = 5 sections from different animals); * p<0.01 compared with control.
Figure 4
Figure 4. The activity of gluconeogenesis enzymes.
The activity of PEPCK, F-1, 6-BPase, and G6Pase was tested in un-dialyzed and dialyzed liver homogenates of control and metformin treated RLIP76+/+ and RLIP76−/− mice (n = 3) as protocols standardized by us . *p<0.001, when compared to RLIP76+/+, and **p<0.005, when compared with metformin treatment in RLIP76+/+. The enzyme PEPCK, catalyze the conversion of phosphoenolpyruvate to fructose 1,6-biphosphate in a series of steps involving oxidation of NADH to NAD. In this assay, the loss of NADH was determined spectrophotometrically by measuring absorbance at 340 nm, based on the method of Opie and Newsholme . To detect F-1, 6-BPase activity, a spectrophotometric coupled enzyme assay was used by a method of Taketa and Pogell . F-1, 6-BPase activity was coupled with phosphoglucose isomerase and NADP dependent glucose 6-phosphate dehydrogenase, and NADPH formation was measured at 340 nm. G6Pase activity was determined spectrophotometrically using the method of Gierow and Jergil . The method is based on a coupled enzyme reaction in which glucose formed is reacted with glucose oxidase and peroxidase and the quinoneimine formed is a colored product and its formation can be followed spectrophotometrically at 510 nm.
Figure 5
Figure 5. Differential effect of atorvastatin (lipitor) in RLIP76+/+ and RLIP76−/− mice.
Panel A: Effect of RLIP76 depletion by RLIP76 antisense on cholesterol level in RLIP76+/+ mice. p<0.02, when compared to scrambled antisense treatment. Panel B: cholesterol level was measured prior to and 24 h after a single oral dose of atorvastatin (80 mg/kg b.w.) by gavage in RLIP76+/+ and RLIP76−/− mice. p<0.001, when compared between RLIP76+/+ and RLIP76−/− mice, and p<0.03 when compared to lipitor treatment in RLIP76+/+ mice. In panels A & B, 6 mice per group were used. Panel C: Effect of atorvastatin on pJNK and HMGCR expression by Western blot in mouse liver tissue lysates, and developed bands were quantified by scanning densitometry. GAPDH expression was used as loading control. WT, wild-type; KO, RLIP76-knockout; Lip, Lipitor.
Figure 6
Figure 6. Differential effect of gemfibrozil in RLIP76+/+ and RLIP76−/− mice.
Panel A: Effect of RLIP76 depletion by RLIP76 antisense on triglycerides level in RLIP76+/+ mice. p<0.02, when compared to scrambled antisense treatment. Panel B: triglycerides level was measured prior to and 24 h after a single oral dose of gemfibrozil (100 mg/kg b.w.) by gavage in RLIP76+/+ and RLIP76−/− mice. p<0.001, when compared between RLIP76+/+ and RLIP76−/− mice, and p<0.02 when compared to gemfibrozil treatment in RLIP76+/+ mice. In panels A & B, 5 mice per group were used. Panel C: Effect of gemfibrozil on PPARα expression by Western blot in mouse liver tissue lysates, and developed bands were quantified by scanning densitometry. GAPDH expression was used as loading control. WT, wild-type; KO, RLIP76-knockout; Gemf, gemfibrozil; Panel D: Effect of gemfibrozil on PPARα expression in paraffin embedded RLIP76+/+ and RLIP76−/− mouse liver tissues section by immuno-histochemistry using ABC staining kit (Vector). Immuno-reactivity is evident as a dark brown stain, whereas non-reactive areas display only the background color. Sections were counter-stained with Hematoxylin (blue). Photographs at 40× magnification were acquired using Olympus Provis AX70 microscope. Percent staining was determined by measuring positive immuno-reactivity per unit area. Arrows represent the area for positive staining for an antigen. The intensity of antigen staining was quantified by digital image analysis. Bars represent mean ± S.E. (n = 5); * p<0.002 compared with control.

References

    1. Awasthi S, Singhal SS, Yadav S, Singhal J, Vatsyayan R, et al. A central role of RLIP76 in regulation of glycemic control. Diabetes. 2010;59:714–725. - PMC - PubMed
    1. Cefalu WT. Diabetic dyslipidemia and the metabolic syndrome. Diabetes Metab Syndrome. 2008;2:208–222.
    1. Fonseca MA. The metabolic syndrome, hyperlipidemia, and insulin resistance. Clinical Cornerstone. 2005;7:61–72. - PubMed
    1. Puglianiello A, Cianfarani S. Central control of glucose homeostasis. Rev Diabetic Stud. 2006;3:54–60. - PMC - PubMed
    1. Diehl AM. Fatty liver, hypertension, and the metabolic syndrome. Gut. 2004;53:923–924. - PMC - PubMed

Publication types

MeSH terms