

Rhythm evokes action: early processing of metric deviances in expressive music by experts and laymen revealed by ERP source imaging
- PMID: 21932257
- PMCID: PMC6870197
- DOI: 10.1002/hbm.21397
Rhythm evokes action: early processing of metric deviances in expressive music by experts and laymen revealed by ERP source imaging
Abstract
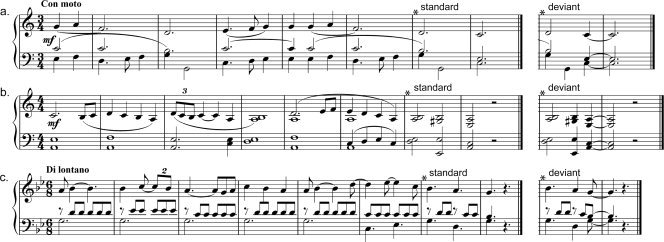
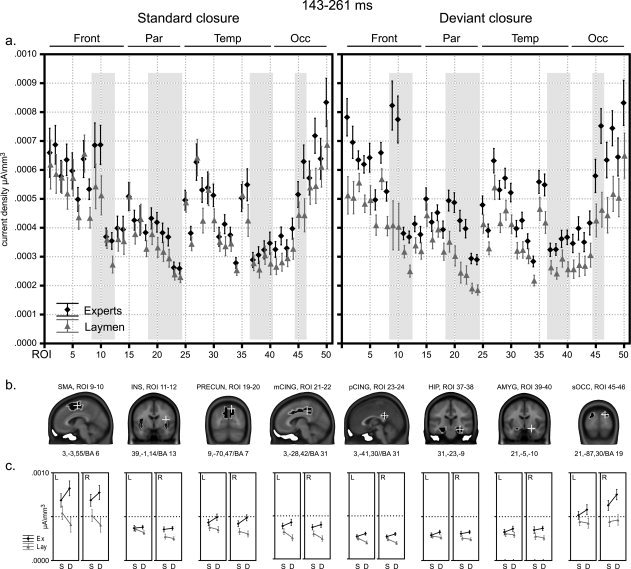
To examine how musical expertise tunes the brain to subtle metric anomalies in an ecological musical context, we presented piano compositions ending on standard and deviant cadences (endings) to expert pianists and musical laymen, while high-density EEG was recorded. Temporal expectancies were manipulated by substituting standard "masculine" cadences at metrically strong positions with deviant, metrically unaccented, "feminine" cadences. Experts detected metrically deviant cadences better than laymen. Analyses of event-related potentials demonstrated that an early P3a-like component (~150-300 ms), elicited by musical closure, was significantly enhanced at frontal and parietal electrodes in response to deviant endings in experts, whereas a reduced response to deviance occurred in laymen. Putative neuronal sources contributing to the modulation of this component were localized in a network of brain regions including bilateral supplementary motor areas, middle and posterior cingulate cortex, precuneus, associative visual areas, as well as in the right amygdala and insula. In all these regions, experts showed enhanced responses to metric deviance. Later effects demonstrated enhanced activations within the same brain network, as well as higher processing speed for experts. These results suggest that early brain responses to metric deviance in experts may rely on motor representations mediated by the supplementary motor area and motor cingulate regions, in addition to areas involved in self-referential imagery and relevance detection. Such motor representations could play a role in temporal sensory prediction evolved from musical training and suggests that rhythm evokes action more strongly in highly trained instrumentalists.
Copyright © 2011 Wiley Periodicals, Inc.
Figures


Similar articles
-
Early neuronal responses in right limbic structures mediate harmony incongruity processing in musical experts.Neuroimage. 2008 Oct 1;42(4):1597-608. doi: 10.1016/j.neuroimage.2008.06.025. Epub 2008 Jul 1. Neuroimage. 2008. PMID: 18640279
-
Processing expectancy violations during music performance and perception: an ERP study.J Cogn Neurosci. 2010 Oct;22(10):2401-13. doi: 10.1162/jocn.2009.21332. J Cogn Neurosci. 2010. PMID: 19702473
-
Effects of musical expertise on the early right anterior negativity: an event-related brain potential study.Psychophysiology. 2002 Sep;39(5):657-63. Psychophysiology. 2002. PMID: 12236333 Clinical Trial.
-
Explaining the high voice superiority effect in polyphonic music: evidence from cortical evoked potentials and peripheral auditory models.Hear Res. 2014 Feb;308:60-70. doi: 10.1016/j.heares.2013.07.014. Epub 2013 Aug 3. Hear Res. 2014. PMID: 23916754 Review.
-
Toward the neural basis of processing structure in music. Comparative results of different neurophysiological investigation methods.Ann N Y Acad Sci. 2003 Nov;999:15-28. doi: 10.1196/annals.1284.002. Ann N Y Acad Sci. 2003. PMID: 14681114 Review.
Cited by
-
Train the brain with music (TBM): brain plasticity and cognitive benefits induced by musical training in elderly people in Germany and Switzerland, a study protocol for an RCT comparing musical instrumental practice to sensitization to music.BMC Geriatr. 2020 Oct 21;20(1):418. doi: 10.1186/s12877-020-01761-y. BMC Geriatr. 2020. PMID: 33087078 Free PMC article. Clinical Trial.
-
Sensorimotor synchronization: a review of recent research (2006-2012).Psychon Bull Rev. 2013 Jun;20(3):403-52. doi: 10.3758/s13423-012-0371-2. Psychon Bull Rev. 2013. PMID: 23397235 Review.
-
Activating and relaxing music entrains the speed of beat synchronized walking.PLoS One. 2013 Jul 10;8(7):e67932. doi: 10.1371/journal.pone.0067932. Print 2013. PLoS One. 2013. PMID: 23874469 Free PMC article. Clinical Trial.
-
Influence of Musical Enculturation on Brain Responses to Metric Deviants.Front Neurosci. 2018 Apr 18;12:218. doi: 10.3389/fnins.2018.00218. eCollection 2018. Front Neurosci. 2018. PMID: 29720932 Free PMC article.
-
Predictable and unpredictable deviance detection in the human hippocampus and amygdala.Cereb Cortex. 2024 Jan 31;34(2):bhad532. doi: 10.1093/cercor/bhad532. Cereb Cortex. 2024. PMID: 38216528 Free PMC article.
References
-
- Bangert M, Peschel T, Schlaug G, Rotte M, Drescher D, Hinrichs H, Heinze HJ, Altenmuller E ( 2006): Shared networks for auditory and motor processing in professional pianists: Evidence from fMRI conjunction. Neuroimage 30: 917–926. - PubMed
-
- Baumann S, Koeneke S, Schmidt CF, Meyer M, Lutz K, Jancke L ( 2007): A network for audio‐motor coordination in skilled pianists and non‐musicians. Brain Res 1161: 65–78. - PubMed
-
- Bengtsson SL, Ullen F, Ehrsson HH, Hashimoto T, Kito T, Naito E, Forssberg H, Sadato N ( 2009): Listening to rhythms activates motor and premotor cortices. Cortex 45: 62–71. - PubMed
-
- Besson M, Faïta F ( 1995): An Event‐Related Potential (ERP) study of musical expectancy: Comparison of musicians with nonmusicians. J Exp Psychol Hum Percept Perform 21: 1278–1296.
-
- Bigand E, Tillmann B, Poulin‐Charronnat B, Manderlier D ( 2005): Repetition priming: Is music special? Q J Exp Psychol A 58: 1347–1375. - PubMed
Publication types
MeSH terms
LinkOut - more resources
Full Text Sources
