. 2011 Oct;240(10):2344-53.
doi: 10.1002/dvdy.22724. Epub 2011 Aug 30.

The identification of different endothelial cell populations within the mouse proepicardium

Affiliations

The identification of different endothelial cell populations within the mouse proepicardium

Stephanie Cossette et al. Dev Dyn. 2011 Oct.

Abstract

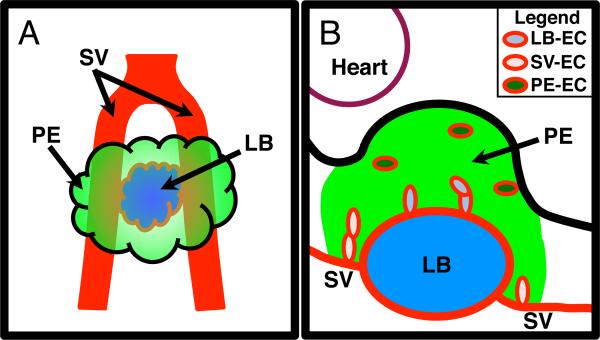
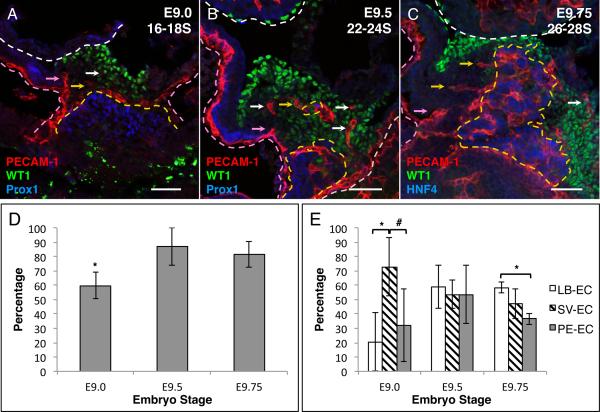
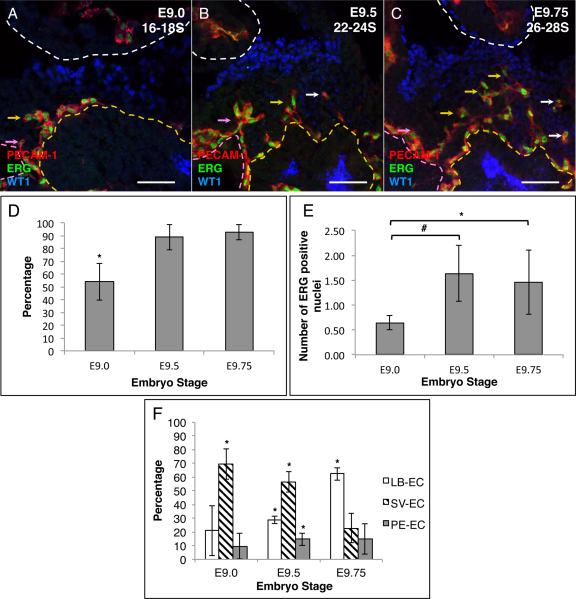
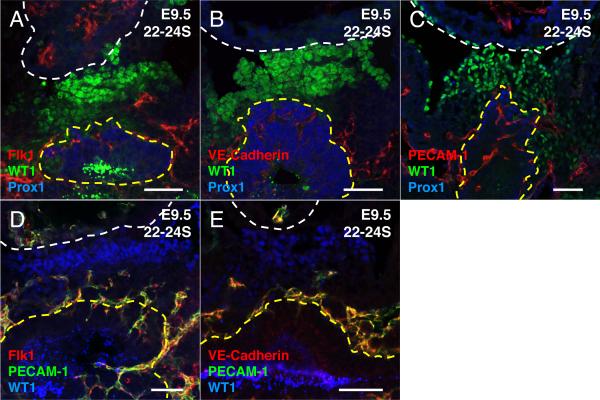
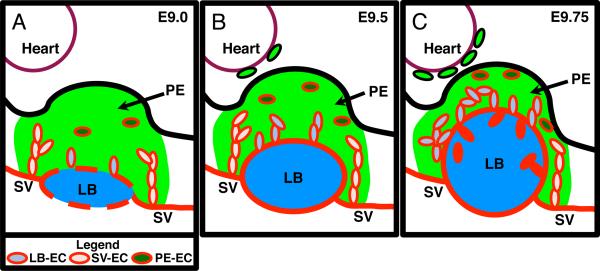
The proepicardium is a transient embryonic structure that is a source of precursors of the epicardium, coronary smooth muscle cells, and may be a source of coronary endothelial cells (EC). To better understand proepicardium development a systematic analysis of EC appearance was performed. Multiple marker analysis showed that EC are present in the mouse proepicardium at embryonic day (E) 9.0 through E9.75. Distinct populations of EC were found that were associated with the liver bud, and the sinus venosus, as well as a population that do not appear to be associated with either of these structures. There was a temporal increase in the number of EC and temporal changes in the distribution of EC within the different populations during PE development. These findings indicate that EC exist in the proepicardium before coronary vasculogenesis, and support a model in which there is a heterogeneous origin for EC in the proepicardium.


Figures

Figure 1
Figure 1
A Illustration displaying the relative location of the PE in comparison to the LB and the SV. Ventral diagram of an E9.5 mouse PE with the PE depicted in green, the SV in red, and the LB in blue. B Illustration displaying the different populations of EC within the mouse E9.5 PE. Depiction of a sagittal section of an E9.5 mouse PE with the green area signifying the PE region, based on WT1 expression. Blue signifies the developing LB. Heart is located in the upper left demarked by a maroon line. Red line demarks EC and vessels. Light blue ovals depict EC associated with the LB (LB-EC), pink ovals depict EC associated with SV (SV-EC) and dark green ovals depict EC not associated with the SV or LB (PE-EC).
Figure 2
Figure 2
PECAM-1 positive cells are present in the developing mouse PE. A–C Immunofluorescence analysis of sagittal sections. A E9.0 16–18 somite (16–18S), B E9.5 22–24 somite (22–24S) and C E9.75 26–28 somite (26–28S) mouse embryos. Sections were stained with the PE marker WT1 (green), EC marker PECAM-1 (red) and LB markers Prox1 or HNF4 (blue). D Percentage of PE confocal step that contain PECAM-1 positive cells in developing mouse PE. E Percentage of PECAM-1 positive confocal steps that contain one or more PECAM-1 positive cells in the three different EC populations (LB-EC, SV-EC and PE-EC). White dashed line demarks the border of the heart. Yellow dashed line demarks the border of the LB. Pink dashed line demarks the SV. Yellow arrows indicate examples of LB-EC, pink arrow indicate examples of SV-EC and white arrows indicate examples of PE-EC. Scale bars = 50μm * p value ≤ 0.05 # p value ≤ 0.1
Figure 3
Figure 3
ERG positive cells are found in the developing mouse PE. A–C Immunofluorescence analysis of sagittal sections. A E9.0 16–18 somite (16–18S), B E9.5 22–24 somite (22–24S) and C E9.75 26–28 somite (26–28S) mouse embryos. Sections were stained with the PE marker WT1 (blue), EC markers ERG (green) and PECAM-1 (red). The expression of Prox1 and HNF4 was omitted in these figures to more clearly visualize the co-expression of PECAM-1 and ERG along with the PE marker WT1. D Percentage of PE confocal steps that contain ERG positive cells in developing mouse PE. E Average number of ERG positive cells per mm of PE width. F Percentage of ERG positive cells within the individual EC populations (LB-EC, SV-EC and PE-EC). White dashed line demarks the border of the heart. Yellow dashed line demarks the border of the LB. Pink dashed line demarks the SV. Yellow arrows indicate examples of LB-EC, pink arrow indicate examples of SV-EC and white arrows indicate examples of PE-EC. Scale bars = 50μm * p value ≤ 0.05 # p value ≤ 0.1
Figure 4
Figure 4
Early and late EC marker positive cells are found in E9.5 mouse PE. A–E Immunofluorescence analysis of sagittal sections from E9.5 22–24 somite (22–24S) mouse embryos. A–C Sections were stained with the PE marker WT1 (green), LB marker Prox1 (blue), EC markers A Flk1 (red) B VE-Cadherin (red) C PECAM-1 (red). D–E Flk1 and VE-Cadherin positive cells also co-express PECAM-1 in the E9.5 mouse PE. Sections were stained with WT1 (blue), PECAM-1 (green) and D FLK1 (red) E VE-Cadherin (red). White dashed line demarks the border of the heart. Yellow dashed line demarks the border of the LB. Scale bars = 50μm
Figure 5
Figure 5
Schematic model of EC involvement in the developing mouse. Individual panels depict sagittal sections of A E9.0, B E9.5 and C E9.75 mouse PEs. See Figure 1B for description of symbols and colors. A In E9.0 PE, angioblasts within the PE and on the surface of the LB begin to differentiate into EC. EC from the SV migrate into the PE and provide the majority of EC to the PE. B In E9.5 PE, the LB is expanding and is now fully surrounded by EC and there is an increase in LB-EC however SV-EC is still the largest population of EC in the PE. WT1 positive PE cells begin to migrate to the surface of the heart. C In E9.75, the LB has greatly expanded into the PE. The LB is now the largest contributor of EC within the PE.

References

    1. Baldwin H, Shen H, Yan H, DeLisser H, Chung A, Mickanin C, Trask T, Kirschbaum N, Newman P, Albelda S, et al. Platelet endothelial cell adhesion molecule-1 (PECAM-1/CD31): alternatively spliced, functionally distinct isoforms expressed during mammalian cardiovascular development. Development. 1994;120:2539–2553. - PubMed
    1. Battle M, Konopka G, Parviz F, Gaggl A, Yang C, Sladek F, Duncan S. Hepatocyte nuclear factor 4alpha orchestrates expression of cell adhesion proteins during the epithelial transformation of the developing liver. Proc Natl Acad Sci U S A. 2006;103:8419–8424. - PMC - PubMed
    1. Burke Z, Oliver G. Prox1 is an early specific marker for the developing liver and pancreas in the mammalian foregut endoderm. Mech Dev. 2002;118:147–155. - PubMed
    1. Cai C, Martin J, Sun Y, Cui L, Wang L, Ouyang K, Yang L, Bu L, Liang X, Zhang X, Stallcup W, Denton C, McCulloch A, Chen J, Evans S. A myocardial lineage derives from Tbx18 epicardial cells. Nature. 2008;454:104–108. - PMC - PubMed
    1. del Monte G, Casanova J, Guadix J, MacGrogan D, Burch J, Perez-Pomares J, de la Pompa J. Differential Notch signaling in the epicardium is required for cardiac inflow development and coronary vessel morphogenesis. Circ Res. 2011;108:824–836. - PubMed

Publication types

Substances

LinkOut - more resources