. 2011 Nov;34(5):1080-91.
doi: 10.1002/jmri.22725. Epub 2011 Sep 19.

The presence of two local myocardial sheet populations confirmed by diffusion tensor MRI and histological validation

Affiliations

The presence of two local myocardial sheet populations confirmed by diffusion tensor MRI and histological validation

Geoffrey L Kung et al. J Magn Reson Imaging. 2011 Nov.

Abstract

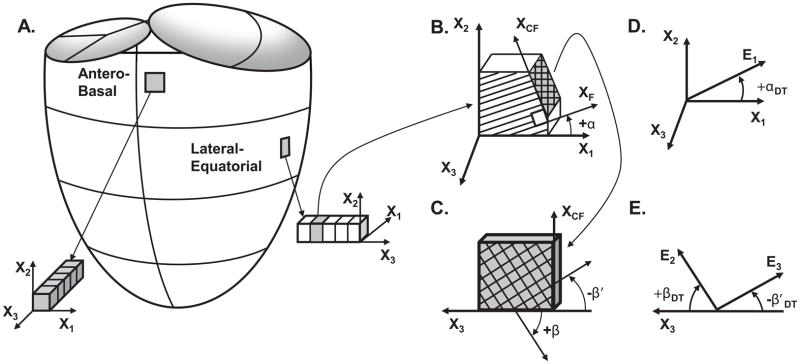
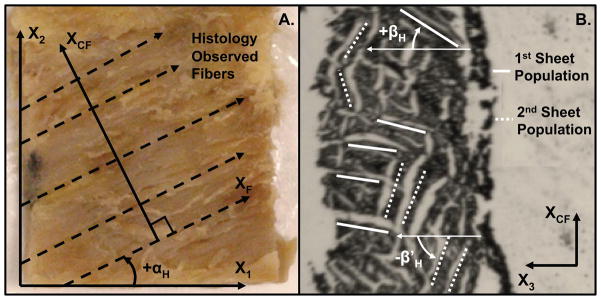
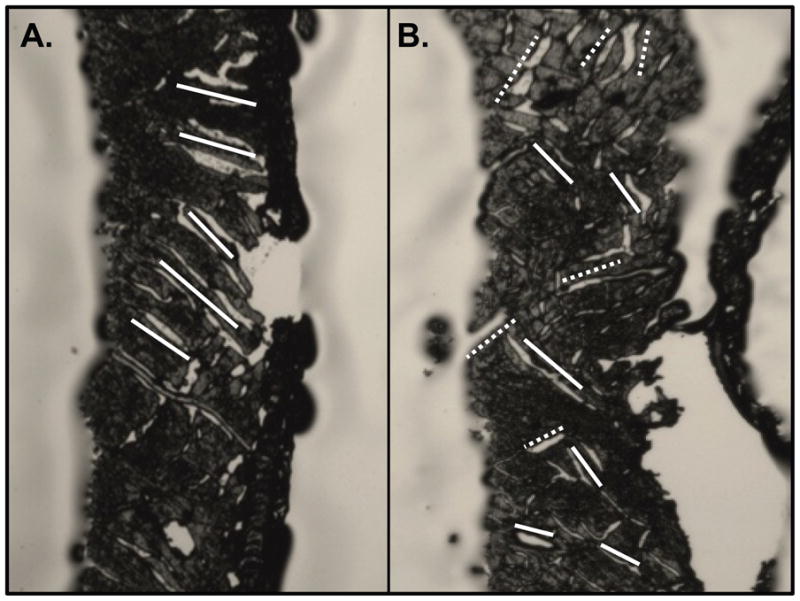
Purpose: To establish the correspondence between the two histologically observable and diffusion tensor MRI (DTMRI) measurements of myolaminae orientation for the first time and show that single myolaminar orientations observed in local histology may result from histological artifact.

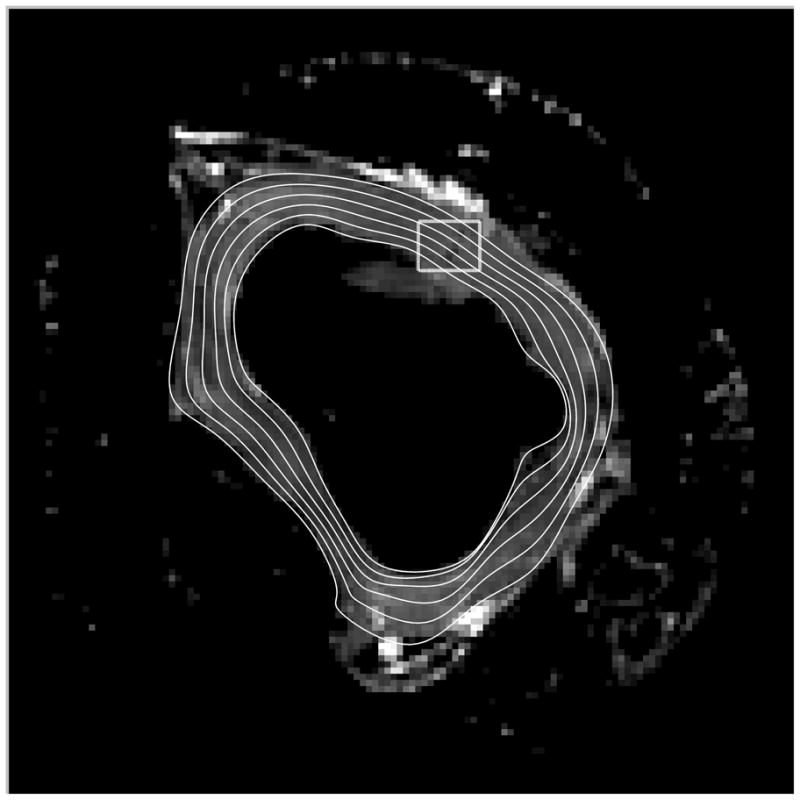
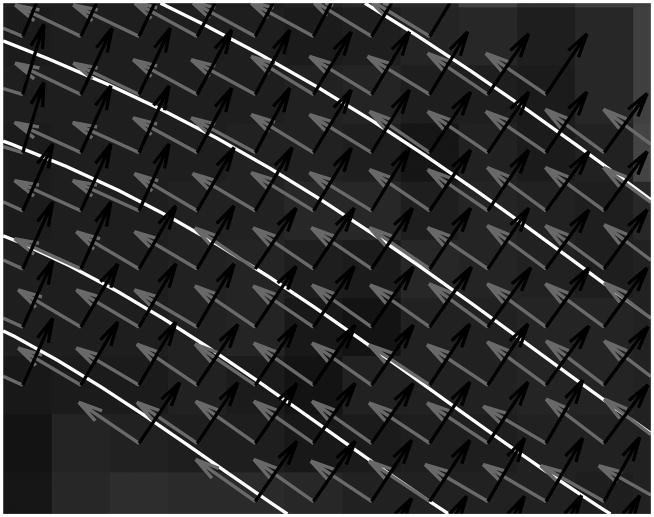
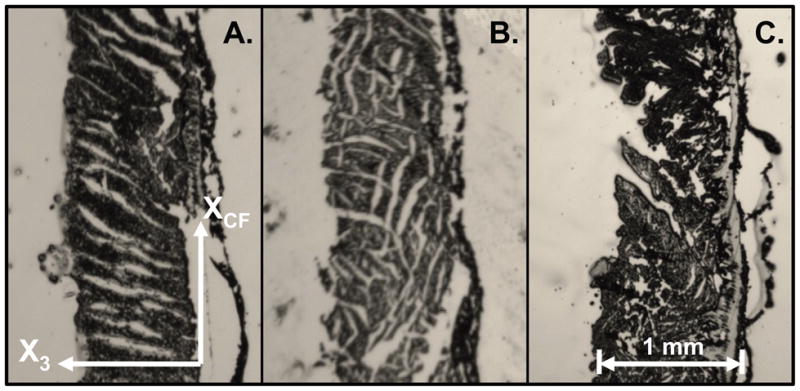
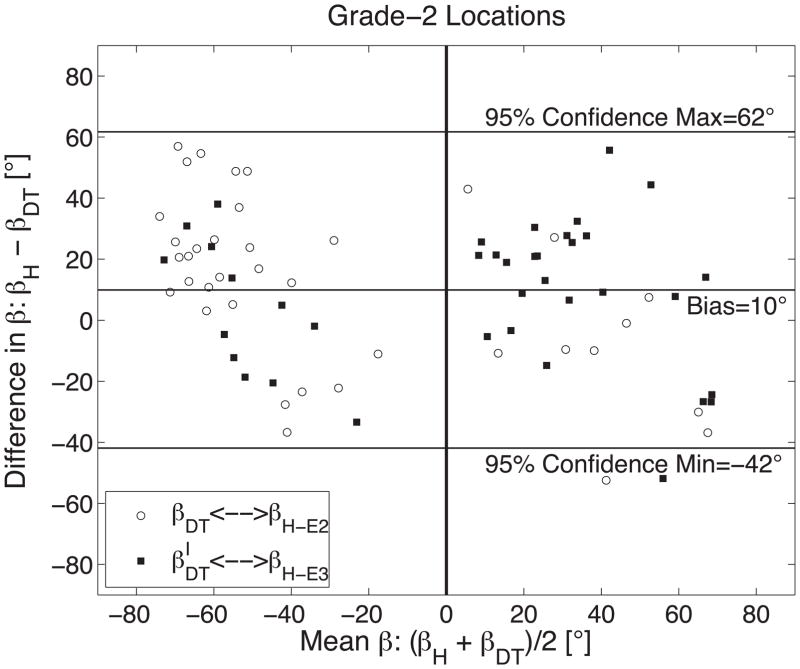
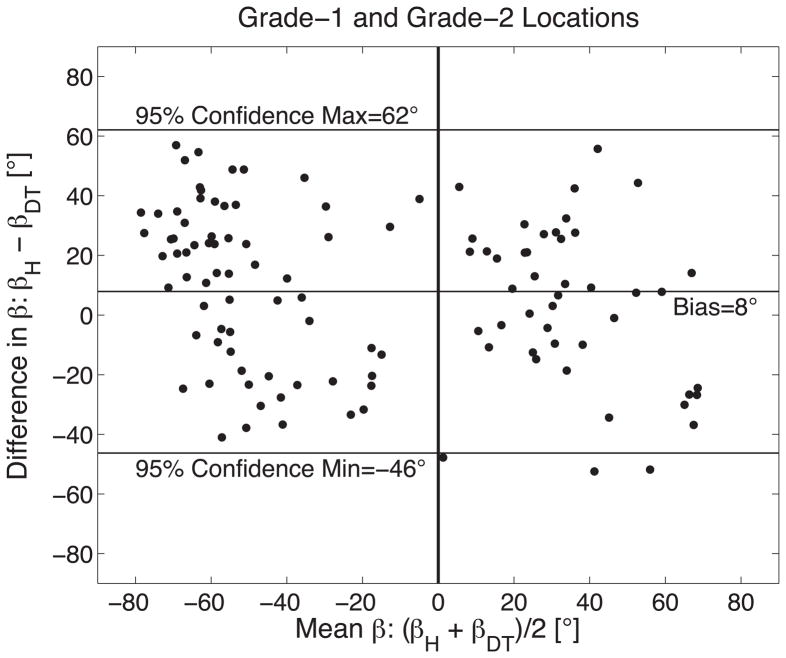
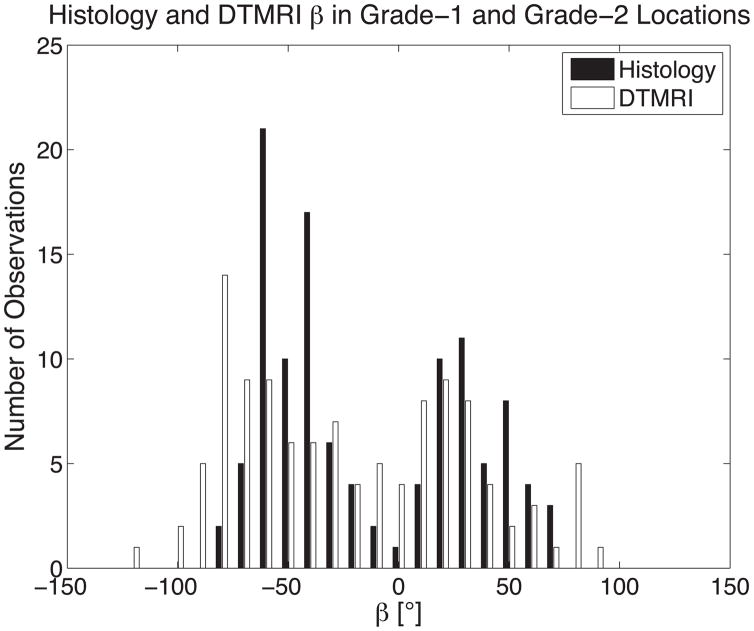
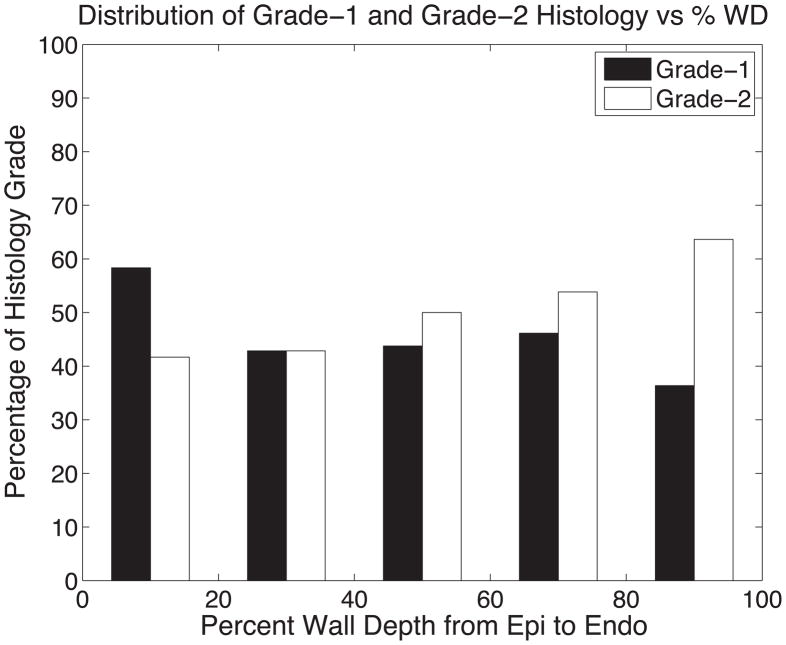
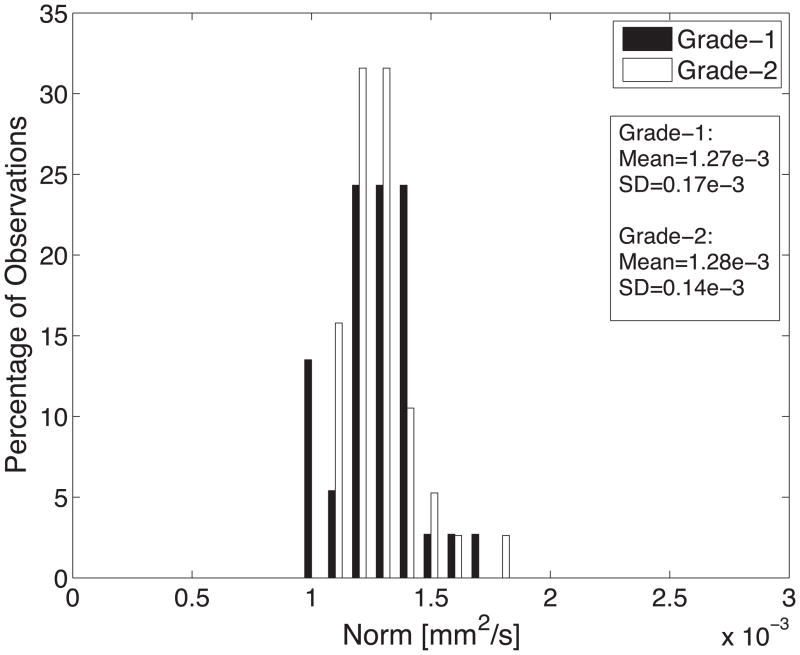
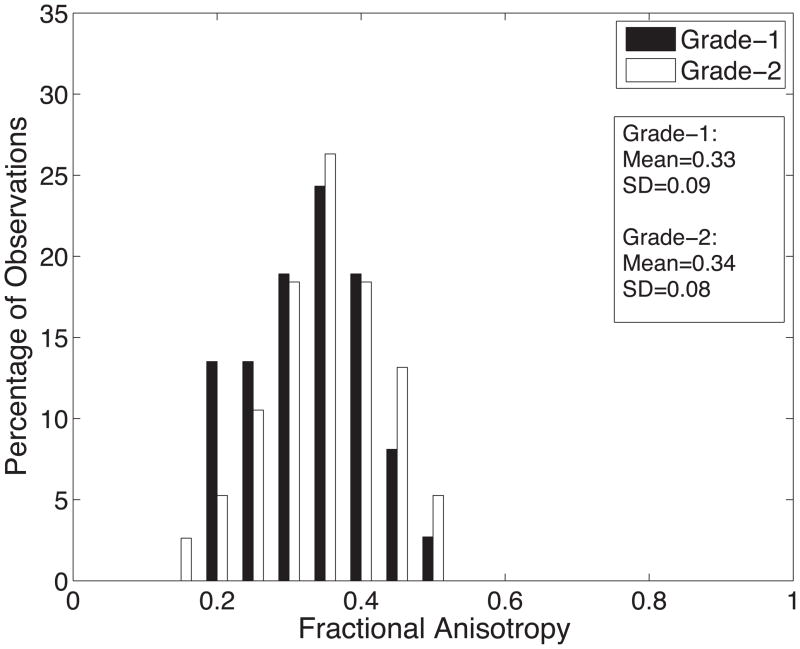
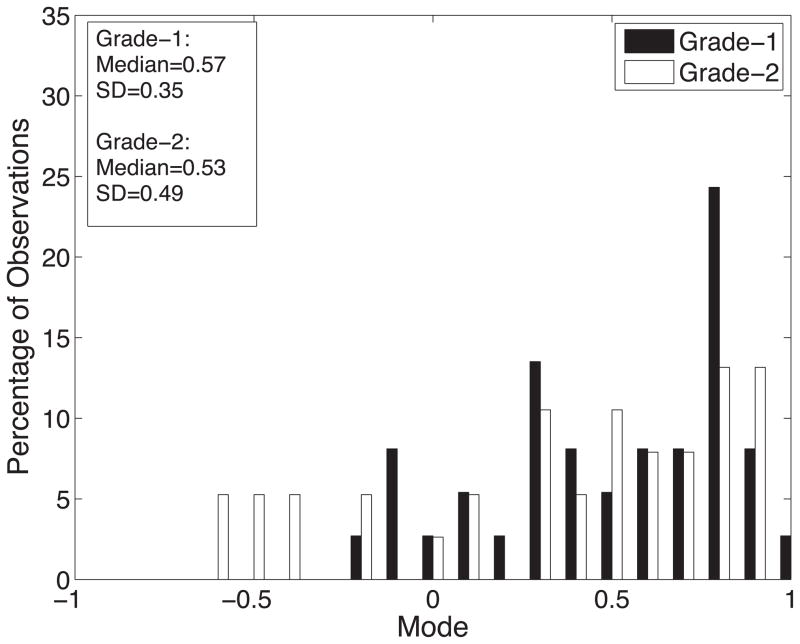
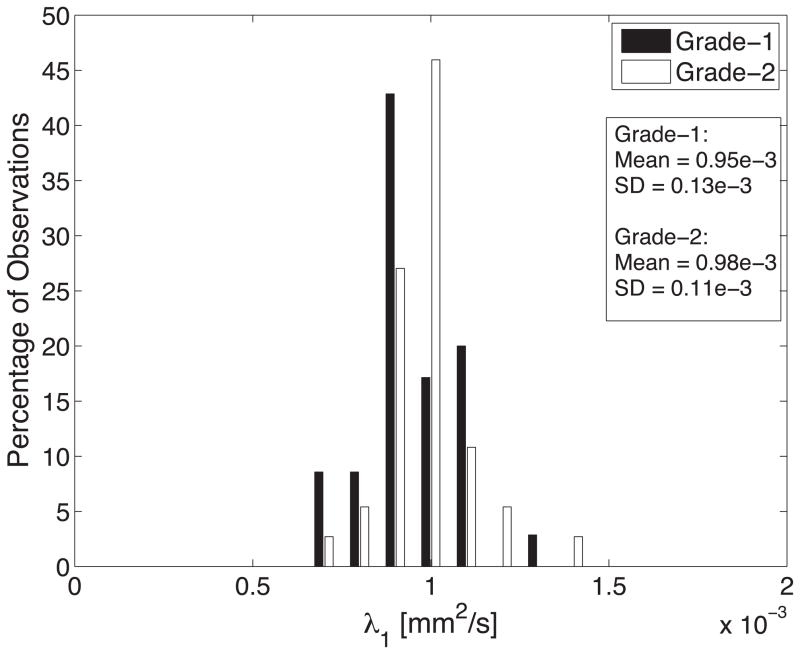
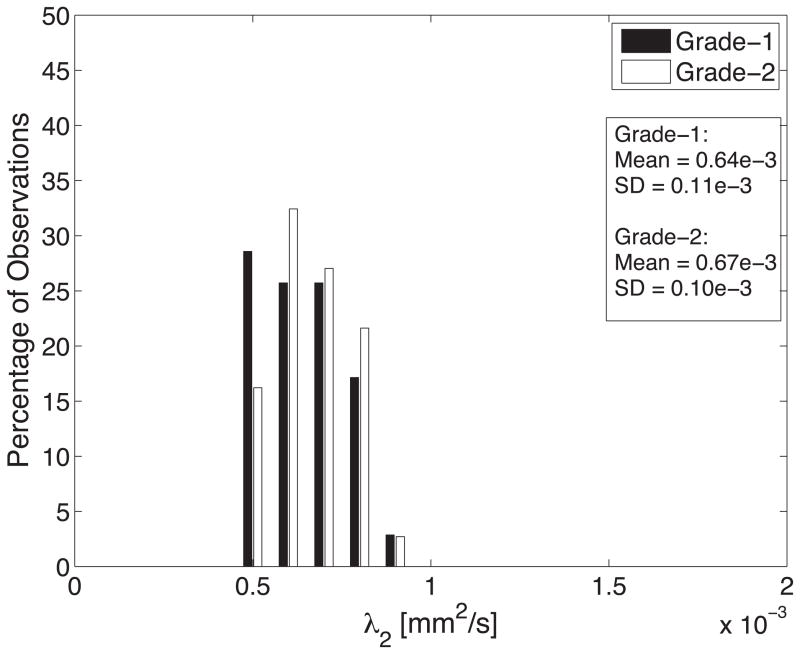
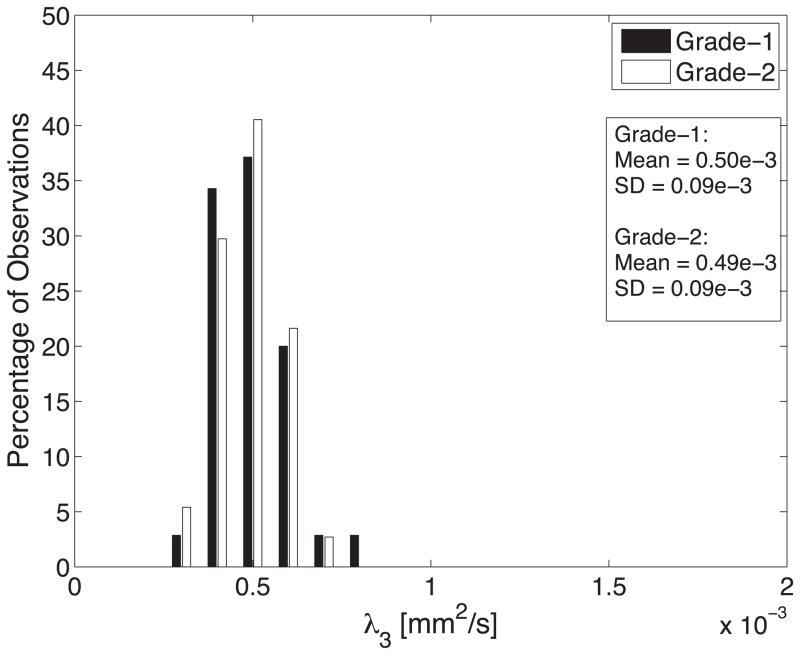
Materials and methods: DTMRI was performed on six sheep left ventricles (LV), then corresponding direct histological transmural measurements were made within the anterobasal and lateral-equatorial LV. Secondary and tertiary eigenvectors of the diffusion tensor were compared with each of the two locally observable sheet orientations from histology. Diffusion tensor invariants were calculated to compare differences in microstructural diffusive properties between histological locations with one observable sheet population and two observable sheet populations.

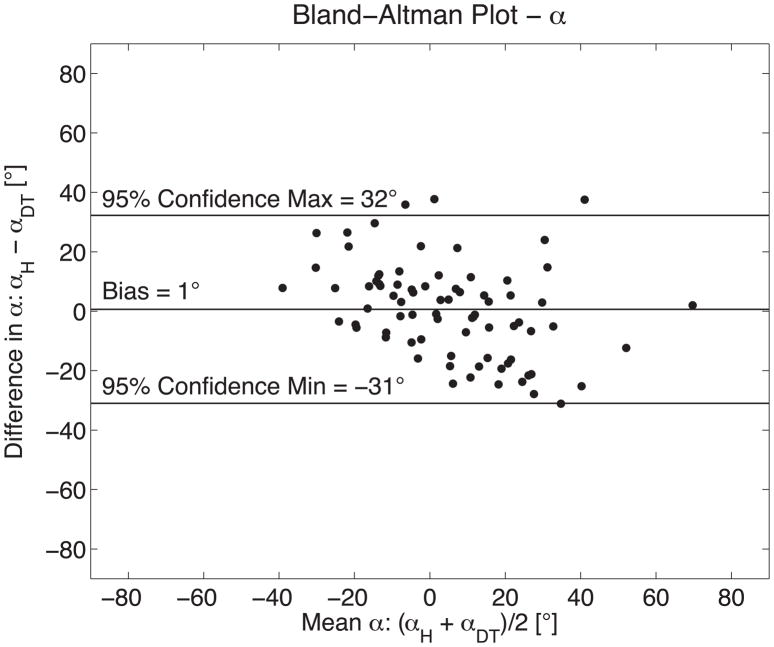
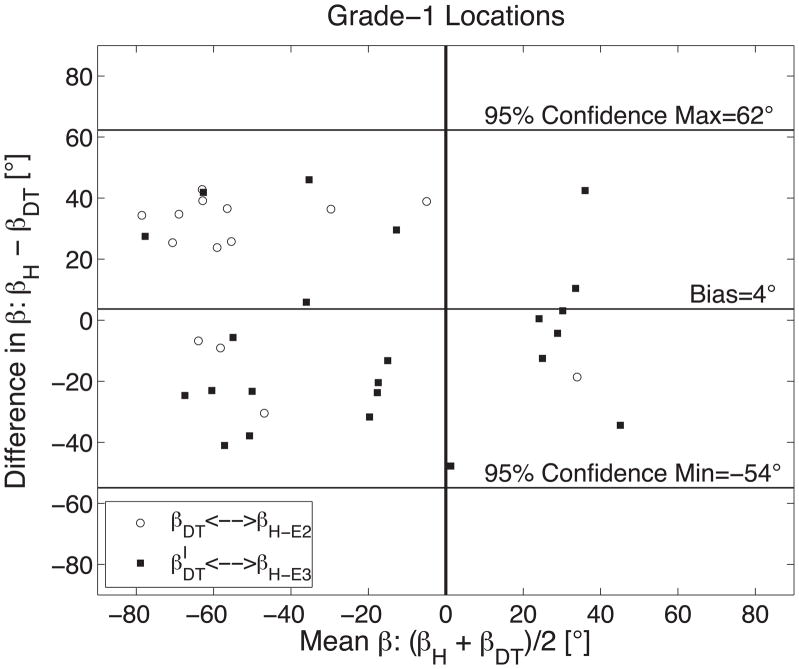
Results: Mean difference ± 1SD between DTMRI and histology measured sheet angles was 8° ± 27°. Diffusion tensor invariants showed no significant differences between histological locations with one observable sheet population and locations with two observable sheet populations.

Conclusion: DTMRI measurements of myolaminae orientations derived from the secondary and tertiary eigenvectors correspond to each of the two local myolaminae orientations observed in histology. Two local sheet populations may exist throughout LV myocardium, and one local sheet population observed in histology may be a result of preparation artifact.


Figures

Figure 1
Figure 1
Myocardial fiber and sheet angles were measured using quantitative histological methods within transmural tissue blocks from the antero-basal or lateral-equatorial wall (A). The local cardiac coordinate system and local fiber angle is depicted in (B), wherein the local circumferential axis (X1), longitudinal axis (X2), radial axis (X3), fiber axis (XF) and cross-fiber axis (XCF) are defined and used to quantify the local fiber angle (α). An en face view of the X3-XCF plane in (C) allows depiction of the two sheet angles (β and β′). Fiber and sheet angles were also measured using DTMRI. The DTMRI fiber angle (αDT) was defined using the primary eigenvector (E1) and local circumferential axis (X1) in (D). The DTMRI measured sheet angles (βDT and β′DT) were defined using the secondary (E2) and tertiary eigenvectors (E3) and the local radial axis (X3) in (E).
Figure 2
Figure 2
(A) Epicardial and endocardial contours (white) were derived from b-spline polynomials fitted to segmented images of individual LV short-axis slices and is shown overlaid on the corresponding non-diffusion weighted axial MR image. The intramural contours were derived by weighting the b-spline weights at each control point and these contours were subsequently used to define local circumferential (X1, gray) and radial (X3, black) vectors (B), which is a zoomed-in view from the box in (A).
Figure 2
Figure 2
(A) Epicardial and endocardial contours (white) were derived from b-spline polynomials fitted to segmented images of individual LV short-axis slices and is shown overlaid on the corresponding non-diffusion weighted axial MR image. The intramural contours were derived by weighting the b-spline weights at each control point and these contours were subsequently used to define local circumferential (X1, gray) and radial (X3, black) vectors (B), which is a zoomed-in view from the box in (A).
Figure 3
Figure 3
(A) Histological photo of observed fibers and depiction of histological fiber angle (αH) measured between local X1 and XF. Each dashed vector is a representative measure made by the observer. The local X2 and XCF axes are also shown. The local X3 direction (not shown) points out of the page toward the observer. (B) Histological photo of two observable sheet populations and depiction of histological sheet angles (βH and β′H) measured with respect to the local X3 direction. The local XCF also shown, XF (not shown) points out of the page toward the observer.
Figure 4
Figure 4
Histological photos of frozen microtome-cut sections showing sheet orientations perpendicular to fiber axis from representative samples of a range of appearances. (A) Corresponds to histology grade-1 (one distinct population of sheets); (B) corresponds to histology grade-2 (two distinct populations of sheets); (C) corresponds to histology grade-0 (no quantifiable sheet orientation).
Figure 5
Figure 5
Histological photos of two microtome-cut frozen sections in the same transmural region of the same heart yielding (A) grade-1 and (B) grade-2 scores exhibiting the inconsistencies of histology measurements within the same histological site. In this specific case, the microtome section with the higher grade (B) was used for measurement and the lower grade microtome section (A) was unused.
Figure 6
Figure 6
The measurement agreement between histology (αH) and DTMRI (αDT) derived measures of fiber orientation is demonstrated with a Bland-Altman plot comparing seventy-eight measures of fiber orientation in six sheep hearts. Histology measures were positively biased by 1° with 95% confidence intervals of +32°/−31°. These results are in excellent agreement with previously reported comparisons of histologic and DTMRI methods for quantifying fiber orientation (14,15).
Figure 7
Figure 7
The measurement agreement between histology (βH) and DTMRI (βDT) derived measures of sheet orientation is demonstrated with a Bland-Altman plot comparing 75 measures of sheet orientation in six sheep hearts when (A) histology yielded a grade-1 results (N=37); (B) histology yielded grade-2 results (N=76); and (C) grade-1 and grade-2 results combined. Results in (A) and (B) are grouped into pairings that correspond to E2DT and its histological best match) and E3 (β′DT and its best histological match). A vertical line is shown at (βH + βDT)/2=0 to emphasize the tendency for β-groups to be predominantly clustered into negative and positive groups.
Figure 7
Figure 7
The measurement agreement between histology (βH) and DTMRI (βDT) derived measures of sheet orientation is demonstrated with a Bland-Altman plot comparing 75 measures of sheet orientation in six sheep hearts when (A) histology yielded a grade-1 results (N=37); (B) histology yielded grade-2 results (N=76); and (C) grade-1 and grade-2 results combined. Results in (A) and (B) are grouped into pairings that correspond to E2DT and its histological best match) and E3 (β′DT and its best histological match). A vertical line is shown at (βH + βDT)/2=0 to emphasize the tendency for β-groups to be predominantly clustered into negative and positive groups.
Figure 8
Figure 8
(A) The histogram of all histologically measured sheet angles (black) and DTMRI measured sheet angles (white) at histological grade-1 and grade-2 sites combined shows the bimodal nature of myolaminar orientation. The means of grouping sheet angles into negative and positive groups for DTMRI and histology measurements is summarized in Table 1. (B) The percentage of occurrences of grade-1 and grade-2 histology versus percent wall depth in 20% increments depicting an even distribution of both grades regardless of transmural location.
Figure 8
Figure 8
(A) The histogram of all histologically measured sheet angles (black) and DTMRI measured sheet angles (white) at histological grade-1 and grade-2 sites combined shows the bimodal nature of myolaminar orientation. The means of grouping sheet angles into negative and positive groups for DTMRI and histology measurements is summarized in Table 1. (B) The percentage of occurrences of grade-1 and grade-2 histology versus percent wall depth in 20% increments depicting an even distribution of both grades regardless of transmural location.
Figure 9
Figure 9
Histograms of diffusion tensor invariants that describe the (A) magnitude of isotropy (tensor norm); (B) the magnitude of anisotropy (fractional anisotropy); (C) the kind of anisotropy (tensor mode); (D) λ1; (E) λ2; and (F) λ3 for tissue sections with histological grade-1 (black) or grade-2 (white) scores. There were no statistical differences between the grade-1 and grade-2 tensor invariants or eigenvalues indicating that the diffusive microstructure of the tissue is not significantly different, despite a different appearance with histology.
Figure 9
Figure 9
Histograms of diffusion tensor invariants that describe the (A) magnitude of isotropy (tensor norm); (B) the magnitude of anisotropy (fractional anisotropy); (C) the kind of anisotropy (tensor mode); (D) λ1; (E) λ2; and (F) λ3 for tissue sections with histological grade-1 (black) or grade-2 (white) scores. There were no statistical differences between the grade-1 and grade-2 tensor invariants or eigenvalues indicating that the diffusive microstructure of the tissue is not significantly different, despite a different appearance with histology.

Similar articles

Cited by

References

    1. Chen J, Liu W, Zhang H, et al. Regional ventricular wall thickening reflects changes in cardiac fiber and sheet structure during contraction: quantification with diffusion tensor MRI. Am J Physiol Heart Circ Physiol. 2005;289(5):H1898–1907. - PubMed
    1. Costa KD, Takayama Y, McCulloch AD, Covell JW. Laminar fiber architecture and three-dimensional systolic mechanics in canine ventricular myocardium. Am J Physiol. 1999;276(2 Pt 2):H595–607. - PubMed
    1. LeGrice IJ, Smaill BH, Chai LZ, Edgar SG, Gavin JB, Hunter PJ. Laminar structure of the heart: ventricular myocyte arrangement and connective tissue architecture in the dog. Am J Physiol. 1995;269(2 Pt 2):H571–582. - PubMed
    1. LeGrice IJ, Takayama Y, Covell JW. Transverse shear along myocardial cleavage planes provides a mechanism for normal systolic wall thickening. Circ Res. 1995;77(1):182–193. - PubMed
    1. Hooks DA. Myocardial segment-specific model generation for simulating the electrical action of the heart. Biomed Eng Online. 2007;6:21. - PMC - PubMed

Publication types