

Identifying transient protein-protein interactions in EphB2 signaling by blue native PAGE and mass spectrometry
- PMID: 21932443
- PMCID: PMC3563432
- DOI: 10.1002/pmic.201000819
Identifying transient protein-protein interactions in EphB2 signaling by blue native PAGE and mass spectrometry
Abstract
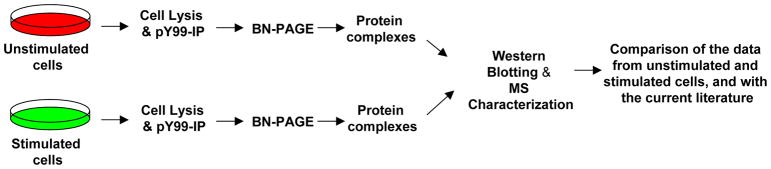
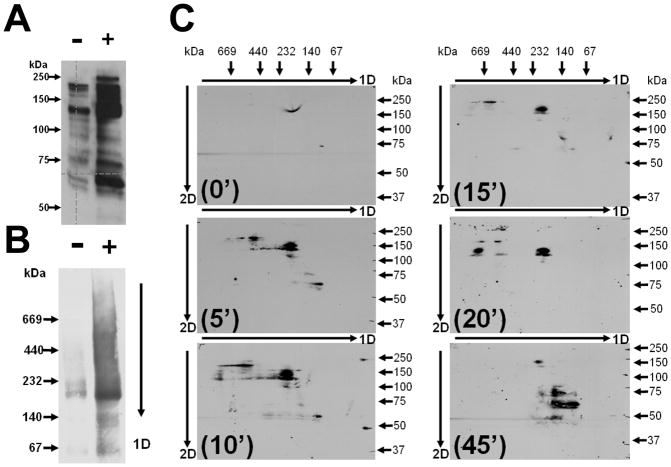
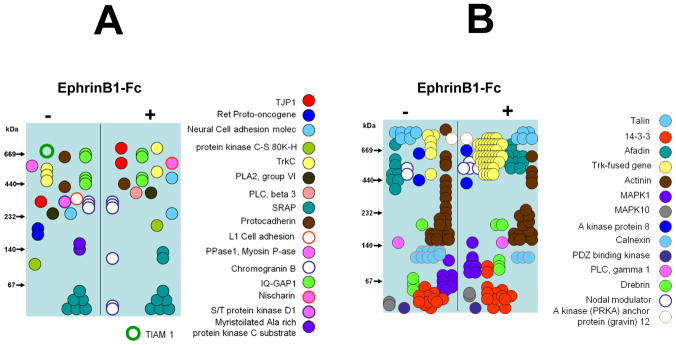
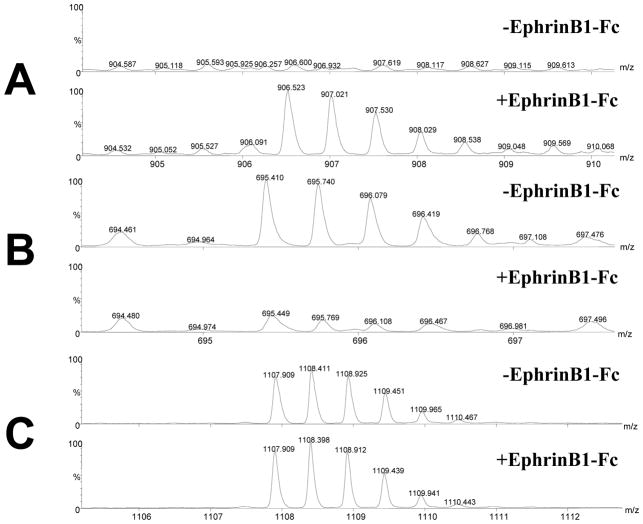
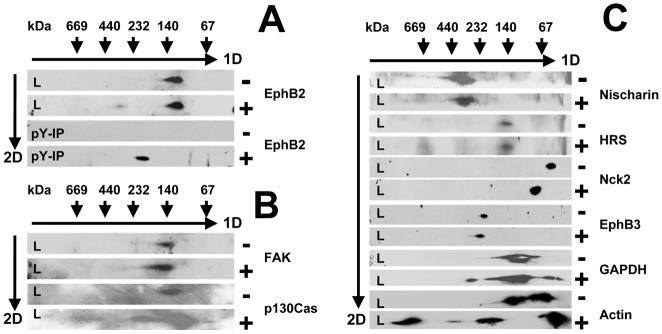
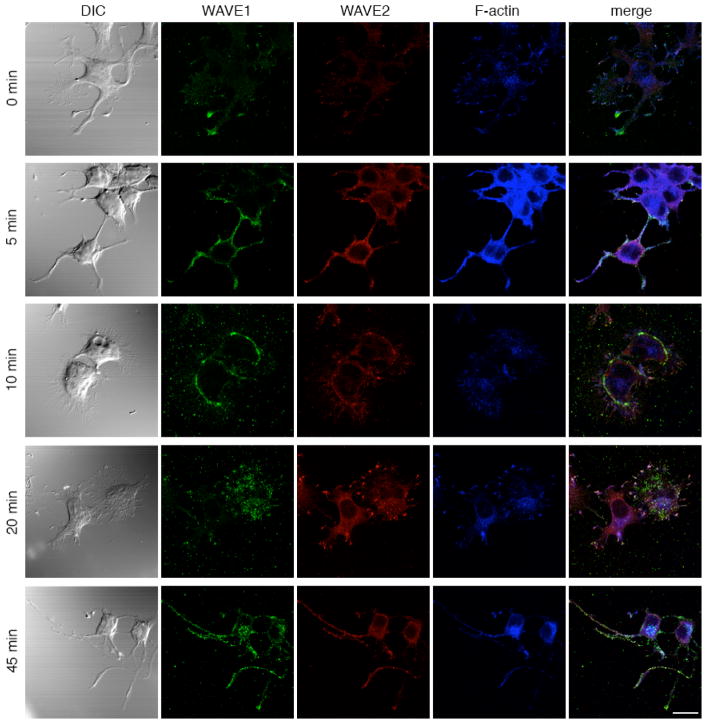
Receptor tyrosine kinases (RTKs) are proteins that upon ligand stimulation undergo dimerization and autophosphorylation. Eph receptors (EphRs) are RTKs that are found in different cell types, from both tissues that are developing and from mature tissues, and play important roles in the development of the central nervous system and peripheral nervous system. EphRs also play roles in synapse formation, neural crest formation, angiogenesis and in remodeling the vascular system. Interaction of EphRs with their ephrin ligands lead to activation of signal transduction pathways and formation of many transient protein-protein interactions that ultimately leads to cytoskeletal remodeling. However, the sequence of events at the molecular level is not well understood. We used blue native PAGE and MS to analyze the transient protein-protein interactions that resulted from the stimulation of EphB2 receptors by their ephrinB1-Fc ligands. We analyzed the phosphotyrosine-containing protein complexes immunoprecipitated from the cell lysates of both unstimulated (-) and ephrinB1-Fc-stimulated (+) NG108 cells. Our experiments allowed us to identify many signaling proteins, either known to be part of EphB2 signaling or new for this pathway, which are involved in transient protein-protein interactions upon ephrinB1-Fc stimulation. These data led us to investigate the roles of proteins such as FAK, WAVEs and Nischarin in EphB2 signaling.
Copyright © 2011 WILEY-VCH Verlag GmbH & Co. KGaA, Weinheim.
Figures

Similar articles
-
The Shb scaffold binds the Nck adaptor protein, p120 RasGAP, and Chimaerins and thereby facilitates heterotypic cell segregation by the receptor EphB2.J Biol Chem. 2020 Mar 20;295(12):3932-3944. doi: 10.1074/jbc.RA119.009276. Epub 2020 Feb 14. J Biol Chem. 2020. PMID: 32060095 Free PMC article.
-
Cell-specific information processing in segregating populations of Eph receptor ephrin-expressing cells.Science. 2009 Dec 11;326(5959):1502-9. doi: 10.1126/science.1176615. Science. 2009. PMID: 20007894
-
Quantitative phosphotyrosine proteomics of EphB2 signaling by stable isotope labeling with amino acids in cell culture (SILAC).J Proteome Res. 2006 Mar;5(3):581-8. doi: 10.1021/pr050362b. J Proteome Res. 2006. PMID: 16512673 Free PMC article.
-
The Value of EphB2 Receptor and Cognate Ephrin Ligands in Prognostic and Predictive Assessments of Human Breast Cancer.Int J Mol Sci. 2021 Jul 28;22(15):8098. doi: 10.3390/ijms22158098. Int J Mol Sci. 2021. PMID: 34360867 Free PMC article.
-
Signaling by Eph receptors and their ephrin ligands.Curr Opin Neurobiol. 1998 Jun;8(3):375-82. doi: 10.1016/s0959-4388(98)80064-0. Curr Opin Neurobiol. 1998. PMID: 9687349 Review.
Cited by
-
Investigation of the effects of overexpression of jumping translocation breakpoint (JTB) protein in MCF7 cells for potential use as a biomarker in breast cancer.Am J Cancer Res. 2022 Apr 15;12(4):1784-1823. eCollection 2022. Am J Cancer Res. 2022. PMID: 35530281 Free PMC article.
-
A Serine/Threonine Kinase 16-Based Phospho-Proteomics Screen Identifies WD Repeat Protein-1 As A Regulator Of Constitutive Secretion.Sci Rep. 2018 Aug 29;8(1):13049. doi: 10.1038/s41598-018-31426-1. Sci Rep. 2018. PMID: 30158666 Free PMC article.
-
Tropomyosin Isoform Diversity in the Cynomolgus Monkey Heart and Skeletal Muscles Compared to Human Tissues.Biochem Res Int. 2023 Jan 24;2023:1303500. doi: 10.1155/2023/1303500. eCollection 2023. Biochem Res Int. 2023. PMID: 36733713 Free PMC article.
-
Matrix stiffness modulates infection of endothelial cells by Listeria monocytogenes via expression of cell surface vimentin.Mol Biol Cell. 2018 Jul 1;29(13):1571-1589. doi: 10.1091/mbc.E18-04-0228. Epub 2018 May 2. Mol Biol Cell. 2018. PMID: 29718765 Free PMC article.
-
Mass spectrometry for the detection of potential psychiatric biomarkers.J Mol Psychiatry. 2013 Jun 5;1(1):8. doi: 10.1186/2049-9256-1-8. eCollection 2013. J Mol Psychiatry. 2013. PMID: 25408901 Free PMC article. Review.
References
-
- Holland SJ, Gale NW, Mbamalu G, Yancopoulos GD, Henkemeyer M, Pawson T. Bidirectional signalling through the EPH-family receptor Nuk and its transmembrane ligands. Nature. 1996;383:722–725. - PubMed
-
- Holland SJ, Peles E, Pawson T, Schlessinger J. Cell-contact-dependent signalling in axon growth and guidance: Eph receptor tyrosine kinases and receptor protein tyrosine phosphatase beta. Curr Opin Neurobiol. 1998;8:117–127. - PubMed
-
- Wilkinson DG. Multiple roles of EPH receptors and ephrins in neural development. Nat Rev Neurosci. 2001;2:155–164. - PubMed
-
- Dalva MB, Takasu MA, Lin MZ, Shamah SM, Hu L, Gale NW, Greenberg ME. EphB receptors interact with NMDA receptors and regulate excitatory synapse formation. Cell. 2000;103:945–956. - PubMed
-
- Robinson V, Smith A, Flenniken AM, Wilkinson DG. Roles of Eph receptors and ephrins in neural crest pathfinding. Cell Tissue Res. 1997;290:265–274. - PubMed
Publication types
MeSH terms
Substances
Grants and funding
LinkOut - more resources
Full Text Sources
Miscellaneous
