

MetSign: a computational platform for high-resolution mass spectrometry-based metabolomics
- PMID: 21932828
- PMCID: PMC3196362
- DOI: 10.1021/ac2017025
MetSign: a computational platform for high-resolution mass spectrometry-based metabolomics
Abstract
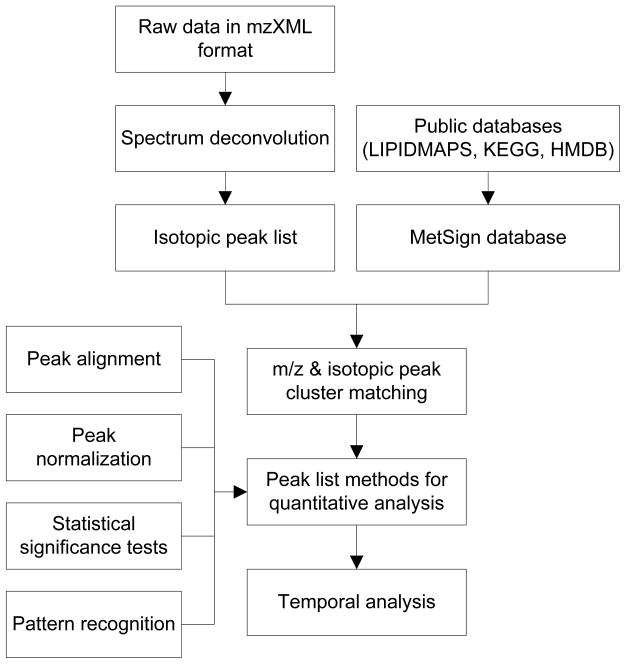
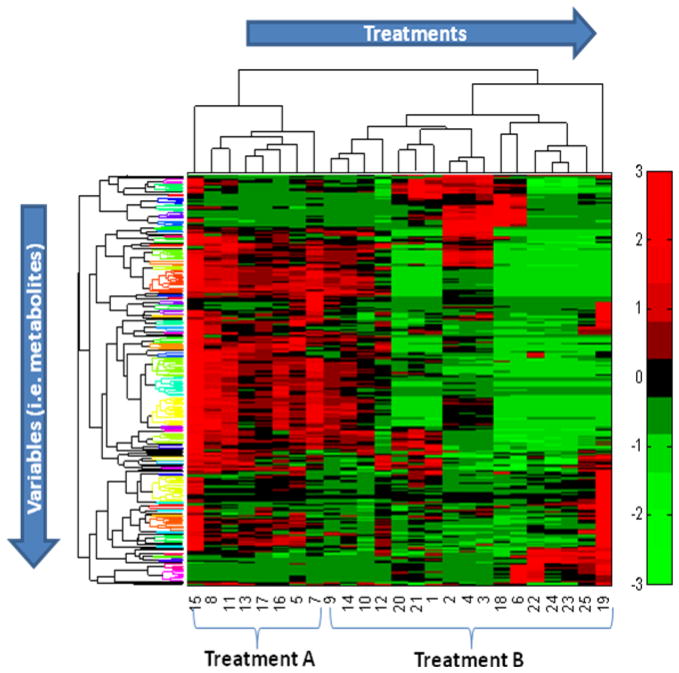
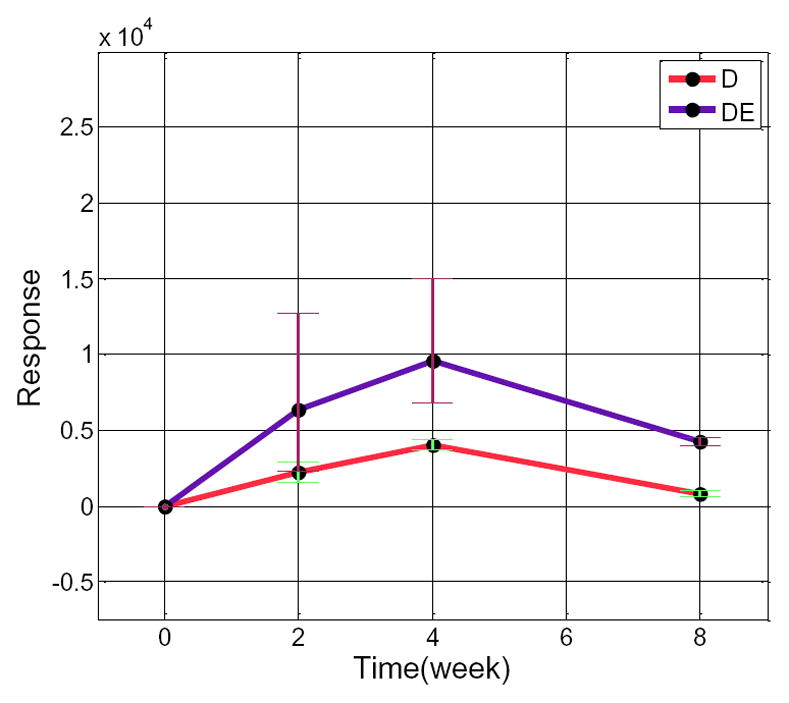
Data analysis in metabolomics is currently a major challenge, particularly when large sample sets are analyzed. Herein, we present a novel computational platform entitled MetSign for high-resolution mass spectrometry-based metabolomics. By converting the instrument raw data into mzXML format as its input data, MetSign provides a suite of bioinformatics tools to perform raw data deconvolution, metabolite putative assignment, peak list alignment, normalization, statistical significance tests, unsupervised pattern recognition, and time course analysis. MetSign uses a modular design and an interactive visual data mining approach to enable efficient extraction of useful patterns from data sets. Analysis steps, designed as containers, are presented with a wizard for the user to follow analyses. Each analysis step might contain multiple analysis procedures and/or methods and serves as a pausing point where users can interact with the system to review the results, to shape the next steps, and to return to previous steps to repeat them with different methods or parameter settings. Analysis of metabolite extract of mouse liver with spiked-in acid standards shows that MetSign outperforms the existing publically available software packages. MetSign has also been successfully applied to investigate the regulation and time course trajectory of metabolites in hepatic liver.
© 2011 American Chemical Society
Figures
References
-
- Gao P, Lu C, Zhang F, Sang P, Yang D, Li X, Kong H, Yin P, Tian J, Lu X, Lu A, Xu G. Analyst. 2008;133:1214–1220. - PubMed
-
- Kieken F, Pinel G, Antignac JP, Monteau F, Christelle Paris A, Popot MA, Bonnaire Y, Le Bizec B. Anal Bioanal Chem. 2009;394:2119–2128. - PubMed
-
- Mohamed R, Varesio E, Ivosev G, Burton L, Bonner R, Hopfgartner G. Anal Chem. 2009;81:7677–7694. - PubMed
-
- Garcia A, Barbas C. Methods Mol Biol. 708:191–204. - PubMed
-
- Bathen TF, Sitter B, Sjobakk TE, Tessem MB, Gribbestad IS. Cancer Res. 70:6692–6696. - PubMed
Publication types
MeSH terms
Grants and funding
- 1R01GM087735/GM/NIGMS NIH HHS/United States
- R01DK7071765/DK/NIDDK NIH HHS/United States
- P01 AA017103/AA/NIAAA NIH HHS/United States
- R01 AA018844/AA/NIAAA NIH HHS/United States
- R01 AA018016/AA/NIAAA NIH HHS/United States
- P30AA019360/AA/NIAAA NIH HHS/United States
- P30 AA019360/AA/NIAAA NIH HHS/United States
- R37AA010762/AA/NIAAA NIH HHS/United States
- R01 AA015970/AA/NIAAA NIH HHS/United States
- R01AA018844/AA/NIAAA NIH HHS/United States
- R01AA018869/AA/NIAAA NIH HHS/United States
- R01AA015970/AA/NIAAA NIH HHS/United States
- 1RC2AA019385/AA/NIAAA NIH HHS/United States
- P01AA017103/AA/NIAAA NIH HHS/United States
- R01 AA018869/AA/NIAAA NIH HHS/United States
- R01 DK071765/DK/NIDDK NIH HHS/United States
- RC2 AA019385/AA/NIAAA NIH HHS/United States
- R01 GM087735/GM/NIGMS NIH HHS/United States
- R01AA018016/AA/NIAAA NIH HHS/United States
- R37 AA010762/AA/NIAAA NIH HHS/United States
LinkOut - more resources
Full Text Sources
