. 2011 Oct 4;108(40):16813-8.
doi: 10.1073/pnas.1014168108. Epub 2011 Sep 20.

Spatial segregation of BDNF transcripts enables BDNF to differentially shape distinct dendritic compartments

Affiliations

Spatial segregation of BDNF transcripts enables BDNF to differentially shape distinct dendritic compartments

Gabriele Baj et al. Proc Natl Acad Sci U S A. .

Abstract

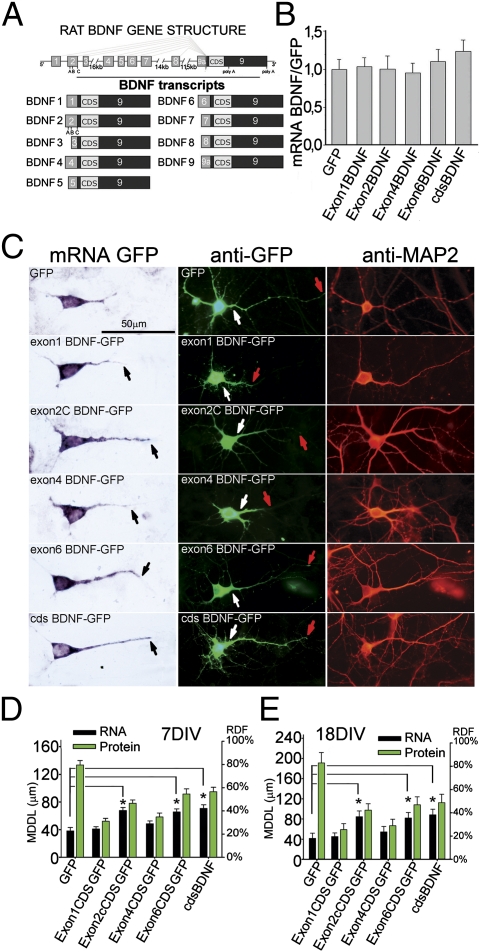
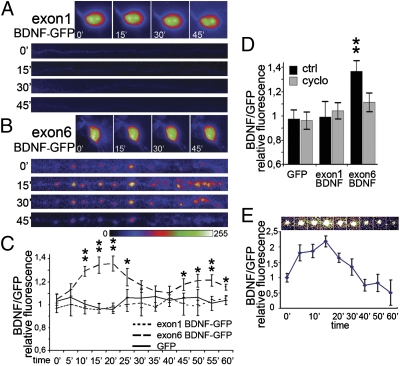
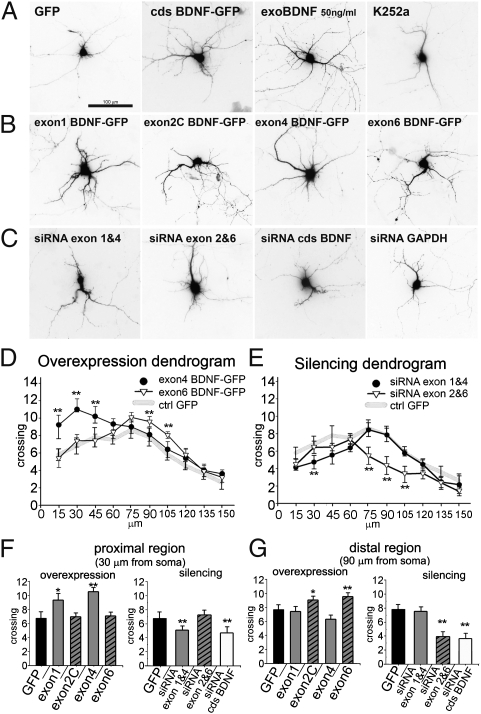
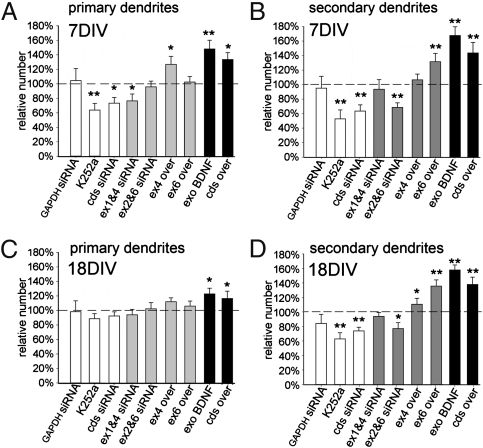
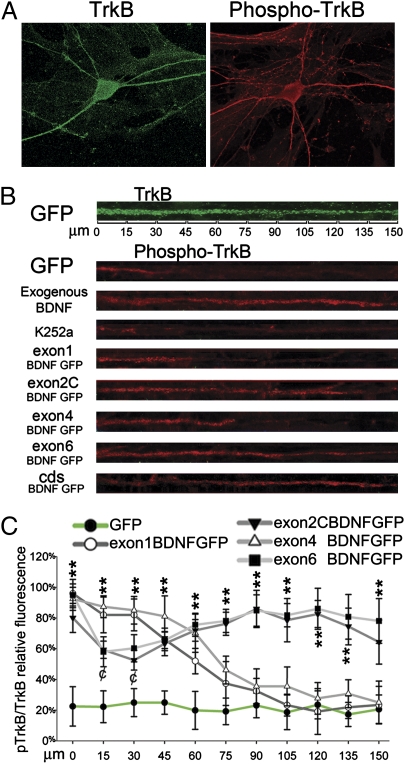
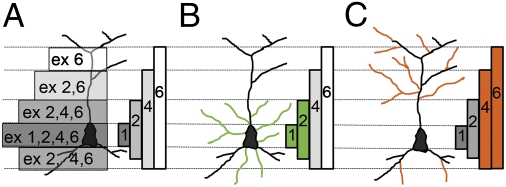
BDNF is produced from many transcripts that display distinct subcellular localization, suggesting that spatially restricted effects occur as a function of genetic and physiological regulation. Different BDNF 5' splice variants give a restricted localization in the cell body or the proximal and distal compartments of dendrites; however, the functional consequences are not known. Silencing individual endogenous transcripts or overexpressing BDNF-GFP transcripts in cultured neurons demonstrated that whereas some transcripts (1 and 4) selectively affected proximal dendrites, others (2C and 6) affected distal dendrites. Moreover, segregation of BDNF transcripts resulted in a highly selective activation of the BDNF TrkB receptor. These studies indicate that spatial segregation of BDNF transcripts enables BDNF to differentially shape distinct dendritic compartments.


Conflict of interest statement

The authors declare no conflict of interest.

Figures

Fig. 1.
Fig. 1.
BDNF transcripts and protein cosegregate. (A) Structure of rat bdnf gene and transcripts. (B) Densitometric analysis of chimeric constructs in the somata of transfected hippocampal neurons (n = 100 neurons per bar). (C) (Left) In situ hybridization on 7DIV cultures of hippocampal neurons transfected with 5′UTR-cdsBDNF-GFP constructs. (Center) Fluorescence of BDNF-GFP proteins. (Right) MAP2 staining. Black arrows show the end point of MDDL; white and red arrows show respectively the starting and ending points of dendritic BDNF-GFP protein labeling. (D and E) Quantification of maximal distance reached by BDNF-GFP mRNAs (black bars) and BDNF-GFP protein (green bars) in dendrites (n = 40 neurons per bar; error whiskers indicate SE) expressed both in MDDL and RDF in 7- (D) and 18-d-old (E) neurons. (*P < 0.05; ANOVA.)
Fig. 2.
Fig. 2.
Local translation of BDNF transcripts. Video time-lapse tracking of fluorescence in the soma and dendrites severed from the cell body of hippocampal neurons transfected with (A) exon1 BDNF-GFP and (B) exon6 BDNF-GFP and depolarized with 10 mM KCl. Images of dendrites show a straightened 150 μm-long segment. Proximal stump on the left. (C) Quantification of fluorescence in isolated dendrites depolarized with 10 mM KCl for the indicated times (0–60 min). (D) Protein synthesis inhibitor cycloheximide abolishes the fluorescence increase for exon6 BDNF-GFP in isolated dendrites. (E) Video time-lapse tracking of a single spot of exon6 BDNF-GFP fluorescence during KCl depolarization in a dendrite isolated from the soma, and quantification of exon6 BDNF-GFP fluorescence of 10 different puncta during KCl depolarization at the indicated time points (0–60 min). Quantitative data are expressed as the mean of 10 dendrites or somata for each condition. Error bars indicate SE. (*P < 0.05; **P < 0.01; Kruskal–Wallis one-way ANOVA.)
Fig. 3.
Fig. 3.
BDNF transcripts produce local effects on the number of dendritic branchings. Examples of 7-d-old neurons, visualized by GFP fluorescence 3 d after transfection with (A) GFP or cdsBDNF-GFP, treatment with 50 ng/mL BDNF or K252a, (B) the indicated BNDF-GFP transcripts, (C) siRNA against endogenous BDNF transcripts, or GAPDH. (D) Expression dendrograms displaying the complete Sholl analysis for exon4 BDNF-GFP (somatic) and exon6 BDNF-GFP (dendritic) constructs. (**P < 0.01 vs. control GFP; ANOVA; n = 50 neurons.) (E) A dendrogram showing the effects on dendritic crossings after silencing of endogenous transcripts. (**P < 0.01 vs. control GFP; n = 50 neurons.) (F and G) Detail of crossing dendrites at 30 μm (F) or 90 μm (G) from the soma in neurons treated as indicated. (*P < 0.05; **P < 0.01 vs. control GFP; n = 50 neurons.)
Fig. 4.
Fig. 4.
Primary and secondary dendrite modulation by BDNF variants in young and mature hippocampal neurons. Quantification of primary (A) and secondary (B) dendrites in young (7 d) hippocampal neurons in relation to control GFP-transfected neurons (100%). White bars represent control experiments using siRNA against GAPDH, or siRNA against cdsBDNF or treatment with K252a. Gray bars represent experiments using silencing or overexpression of BDNF variants. Black bars represent positive control experiments using exogenous BDNF (50 ng/mL) or cdsBDNF overexpression. Quantification of the number of primary (C) and secondary dendrites (D) in mature neurons (18 d). (*P < 0.05; **P < 0.01 vs. control GFP; ANOVA.)
Fig. 5.
Fig. 5.
Local up-regulation of BDNF variants results in local phosphorylation of TrkB. (A) Immunofluorescence for full-length TrkB (green) and phosphorylated TrkB (red) in two similar hippocampal neurons treated for 3 h with 50 ng/mL BDNF. (B) Straightened dendrites of neurons labeled with an anti-TrkB (green) or transfected with the indicated GFP constructs and labeled with anti-pTrkB (red). Treatment with the TrkB inhibitor K252a abolishes staining for pTrkB, whereas addition of 50 ng/mL BDNF led to labeling for pTrkB throughout the entire dendrite length. (C) Semiquantitative densitometric analysis of pTrkB fluorescence intensity in neurons transfected with the different constructs. (**P < 0.01; ANOVA.)
Fig. 6.
Fig. 6.
Model of the BDNF spatial code in hippocampal pyramidal neurons. Localization of morphological effects induced by up-regulation of segregated BDNF transcripts. (A) Gradient of expression of the BDNF protein generated by the different transcripts. (B) In young but not mature neurons, proximal BDNF transcripts containing exons 1 and 4 affect dendrite architecture close to the soma. In green are shown dendrites induced by expression of BDNF transcripts containing exon 1 or 4. (C) In both young and mature neurons, distal dendritic transcripts regulate the morphology of the periphery of the dendritic tree. In orange are shown dendrites induced by expression of exon 2C or 6 BDNF transcripts.

References

    1. Casaccia-Bonnefil P, Gu C, Chao MV. Neurotrophins in cell survival/death decisions. Adv Exp Med Biol. 1999;468:275–282. - PubMed
    1. McAllister AK, Katz LC, Lo DC. Neurotrophins and synaptic plasticity. Annu Rev Neurosci. 1999;22:295–318. - PubMed
    1. Huang EJ, Reichardt LF. Neurotrophins: Roles in neuronal development and function. Annu Rev Neurosci. 2001;24:677–736. - PMC - PubMed
    1. McAllister AK, Lo DC, Katz LC. Neurotrophins regulate dendritic growth in developing visual cortex. Neuron. 1995;15:791–803. - PubMed
    1. McAllister AK, Katz LC, Lo DC. Neurotrophin regulation of cortical dendritic growth requires activity. Neuron. 1996;17:1057–1064. - PubMed

Publication types

Substances