. 2011 Oct 4;108(40):16735-40.
doi: 10.1073/pnas.1112251108. Epub 2011 Sep 20.

Hepatocyte entry leads to degradation of autoreactive CD8 T cells

Affiliations

Hepatocyte entry leads to degradation of autoreactive CD8 T cells

Volker Benseler et al. Proc Natl Acad Sci U S A. .

Abstract

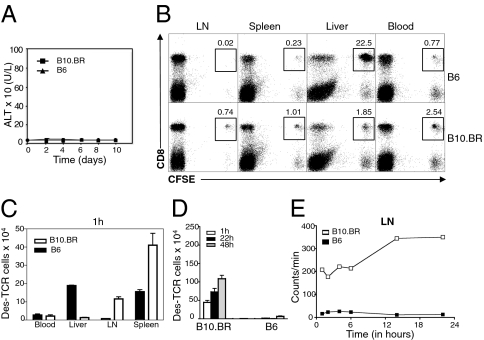
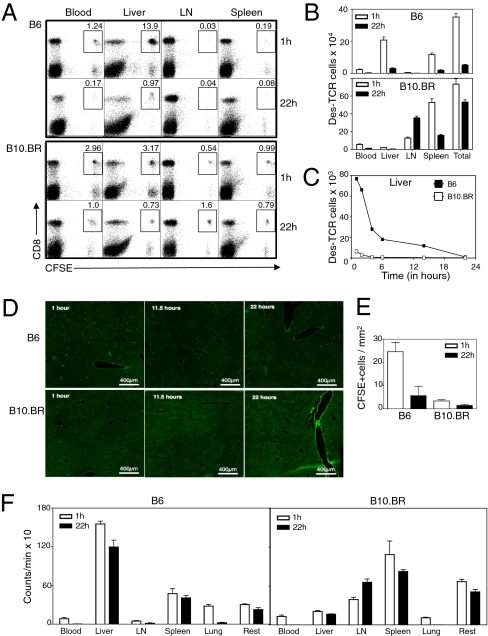
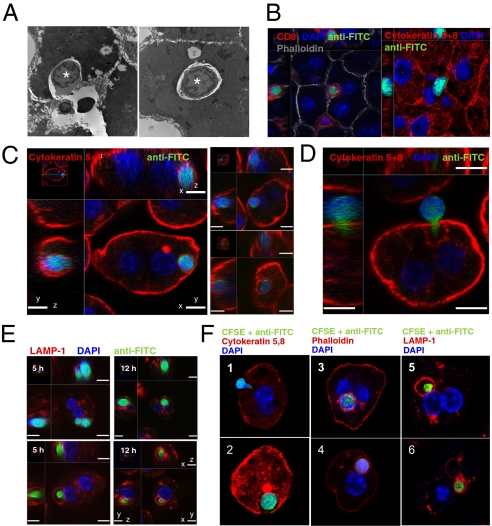
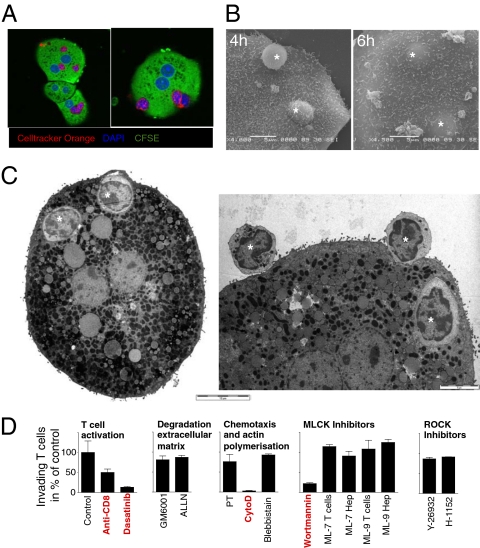
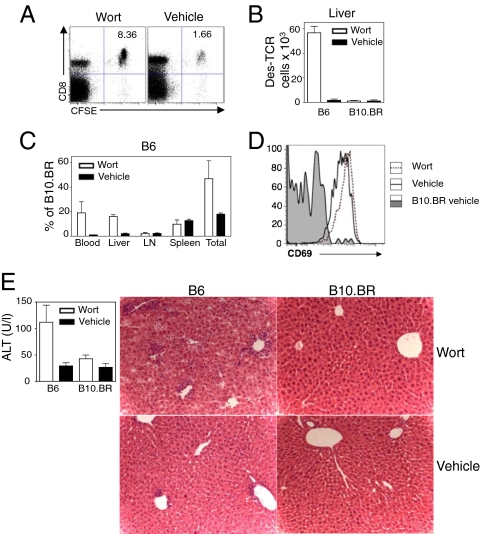
Although most self-reactive T cells are eliminated in the thymus, mechanisms to inactivate or control T cells specific for extrathymic antigens are required and exist in the periphery. By investigating the site in which autoreactive T cells are tolerized, we identify a unique mechanism of peripheral deletion in which naïve autoreactive CD8 T cells are rapidly eliminated in the liver after intrahepatic activation. T cells actively invade hepatocytes, enter endosomal/lysosomal compartments, and are degraded. Blockade of this process leads to accumulation of autoreactive CD8 T cells in the liver and breach of tolerance, with the development of autoimmune hepatitis. Cell into cell invasion, or emperipolesis, is a long-observed phenomenon for which a physiological role has not been previously demonstrated. We propose that this "suicidal emperipolesis" is a unique mechanism of autoreactive T-cell deletion, a process critical for the maintenance of tolerance.


Conflict of interest statement

The authors declare no conflict of interest.

Figures

Fig. 1.
Fig. 1.
Failure to develop graft versus host disease was associated with antigen-specific intrahepatic retention of CD8 Des T cells. (A) ALT levels in B6 and B10.BR mice after transfer of 1.5 × 10⁶ cells isolated from LN of Des mice. (B) FACS profiles of leukocytes purified from LN, spleen, liver, and blood 1 h after transfer of CFSE-labeled Des cells. (C) Distribution of total numbers of Des T cells in different organs 1 h after transfer of CFSE-labeled Des cells (identified as CD8+ CFSE+). Results in the blood are expressed per milliliter. (D) Donor T-cell counts at 1, 22 and 48 h in the LN of B6 and B10.BR recipients after transfer of 1.5 × 10⁶ LN CFSE-labeled LN Des T cells. (E) Radioactivity in LN at various time-points after transfer of 51Cr-labeled CD8 Des T cells into B6 and B10.BR mice. Error bars represent SEM of three mice per group. Data are representative of at least two independent experiments.
Fig. 2.
Fig. 2.
CD8 T cells initially retained in the liver were not recovered at 22 h. (A) FACS profiles of live CFSE-labeled Des cells isolated from blood, liver, LN, and spleen of B6 and B10.BR recipients at 1 h and 22 h after transfer. (B) Quantification of CFSE+ CD8+ T-cell numbers in B6 and B10.BR recipient mice at 1 and 22 h confirming early retention of donor T cells in B6 liver within 1 h after transfer and loss of 90% of donor T cells at 22 h. (C) Time course showing that 75% of donor Des cells recovered from B6 livers were lost within the first 6 h after transfer. (D) Livers sections of B6 and B10.BR recipient mice transfered with purified Oregon-green-labeled donor CD8 Des T cells at different time points. (E) Quantification of cell numbers in similar experiment to D but using CFSE labeled T cells instead of Oregon green. CFSE-labeled T cells were quantified in liver sections by manual cell counting of 10 fields by using a 10× objective. (F) Distribution of radioactivity at 1 and 22 h after transfer of 51Cr radiolabeled naïve Des cells into B6 and B10.BR mice. Results expressed as mean ± SEM of three mice per group. All data, except for D and E (two independent experiments), are representative of at least three independent experiments.
Fig. 3.
Fig. 3.
T cells invaded hepatocytes and were destroyed in lysosomal compartments. (A) TEM of a liver section showing a lymphocyte invading a hepatocyte 3 h after transfer of Des cells into an H-2 Kb+ recipient (Left). Right shows a lymphocyte contained within a giant vesicle inside a hepatocyte. Original magnification ×4,000. (B) CM of B6 liver sections show CFSE-labeled Des cells invading hepatocytes in vivo 6 h after transfer. Donor CFSE was revealed by using an anti-FITC Alexa Fluor-488 antibody. Hepatocytes express Cytokeratin5,8 and are stained in red. (C) CM of purified hepatocytes confirming that CFSE-labeled Des cells were contained within B6 hepatocytes. Right displays more examples of these cell-in-cell structures. (Scale bar: 7 μm.) (D) CFSE-labeled Des T cell with a cytoplasmic protrusion into a B6 hepatocyte suggesting active invasion. (Scale bar: 7 μm.) (E) CM showing B6 hepatocytes containing either whole DAPI+ CD8 Des T cells or a DAPI donor T-cell remnant surrounded by LAMP-1. Hepatocytes were purified from recipient B6 mice at 5 and 12 h after transfer of CFSE-labeled T cells. (Scale bar: 7 μm.) (F) CM of CFSE-labeled OT-I T cells invading and inside hepatocytes at 4–6 h after transfer into SIINFEKL-treated B6 mice. 1, an OT-I T cell is invading a SIINFEKL-loaded hepatocyte. 2–4, a CFSE labeled OT-I T-cell is contained within a hepatocyte vesicle. 5 and 6, T-cell remnants are contained within LAMP-1+ vesicles.
Fig. 4.
Fig. 4.
Wortmannin inhibited T-cell invasion into hepatocytes in vitro. Naïve Cell Tracker Orange-labeled CD8 Des T cells were cocultured with CFSE-labeled H-2Kb+ B6 hepatocytes for 4–6 h. T-cell invasion was visualized by using CM (A), SEM (B) and TEM (C). One, and often several, T cells (* in B and C) were contained in giant vesicles inside hepatocytes. (Scale bars in B and C: 5 μm except Left in C: 10 μm.) (D) CM-based in vitro assay was used to quantify Des cell invasion of hepatocytes in the presence or absence of specific inhibitors and antibodies. Vehicle controls (ethanol, DMSO) had no effect at the dilutions used (in all cases <0.5%). All data are representative of at least three independent experiments.
Fig. 5.
Fig. 5.
Wortmannin inhibited Des T-cell deletion in vivo and broke tolerance in B6 mice. (A) FACS plot of leukocytes purified from the liver of wortmannin and vehicle control treated mice 22 h after transfer. (B) Bar graph showing that the number of donor T cells recovered from the livers of wortmannin treated B6 animals increased in comparison with vehicle treated B6 controls. (C) Relative proportions of Des cells from wortmannin or vehicle control treated B6 mice in relation to B10.BR control animals showing that up to 50% of T cells were rescued at 22 h compared with 20% of vehicle treated animals. (D) Des cells in B6 livers expressed similar levels of CD69 at 22 h after transfer in the presence or absence of wortmannin. (E) After Des cell transfer into untreated and wortmannin-treated animals, wortmannin treatment broke tolerance in B6 animals and induced immune-mediated hepatitis at day 3 as shown by increased ALT levels and histological liver damage (original magnification 200×). Plots indicate mean ± SEM of three mice per group. Experiment was performed at least three times for AD and twice for E with similar results.

Comment in

References

    1. Sprent J, Kishimoto H. The thymus and negative selection. Immunol Rev. 2002;185:126–135. - PubMed
    1. Derbinski J, et al. Promiscuous gene expression in thymic epithelial cells is regulated at multiple levels. J Exp Med. 2005;202:33–45. - PMC - PubMed
    1. Srinivasan M, Frauwirth KA. Peripheral tolerance in CD8+ T cells. Cytokine. 2009;46:147–159. - PubMed
    1. Redmond WL, Sherman LA. Peripheral tolerance of CD8 T lymphocytes. Immunity. 2005;22:275–284. - PubMed
    1. Feuerer M, et al. Bone marrow as a priming site for T-cell responses to blood-borne antigen. Nat Med. 2003;9:1151–1157. - PubMed

Publication types