. 2011 Nov;60(11):2963-74.
doi: 10.2337/db11-0549. Epub 2011 Sep 20.

TRB3 gene silencing alleviates diabetic cardiomyopathy in a type 2 diabetic rat model

Affiliations

TRB3 gene silencing alleviates diabetic cardiomyopathy in a type 2 diabetic rat model

Yun Ti et al. Diabetes. 2011 Nov.

Erratum in

Abstract

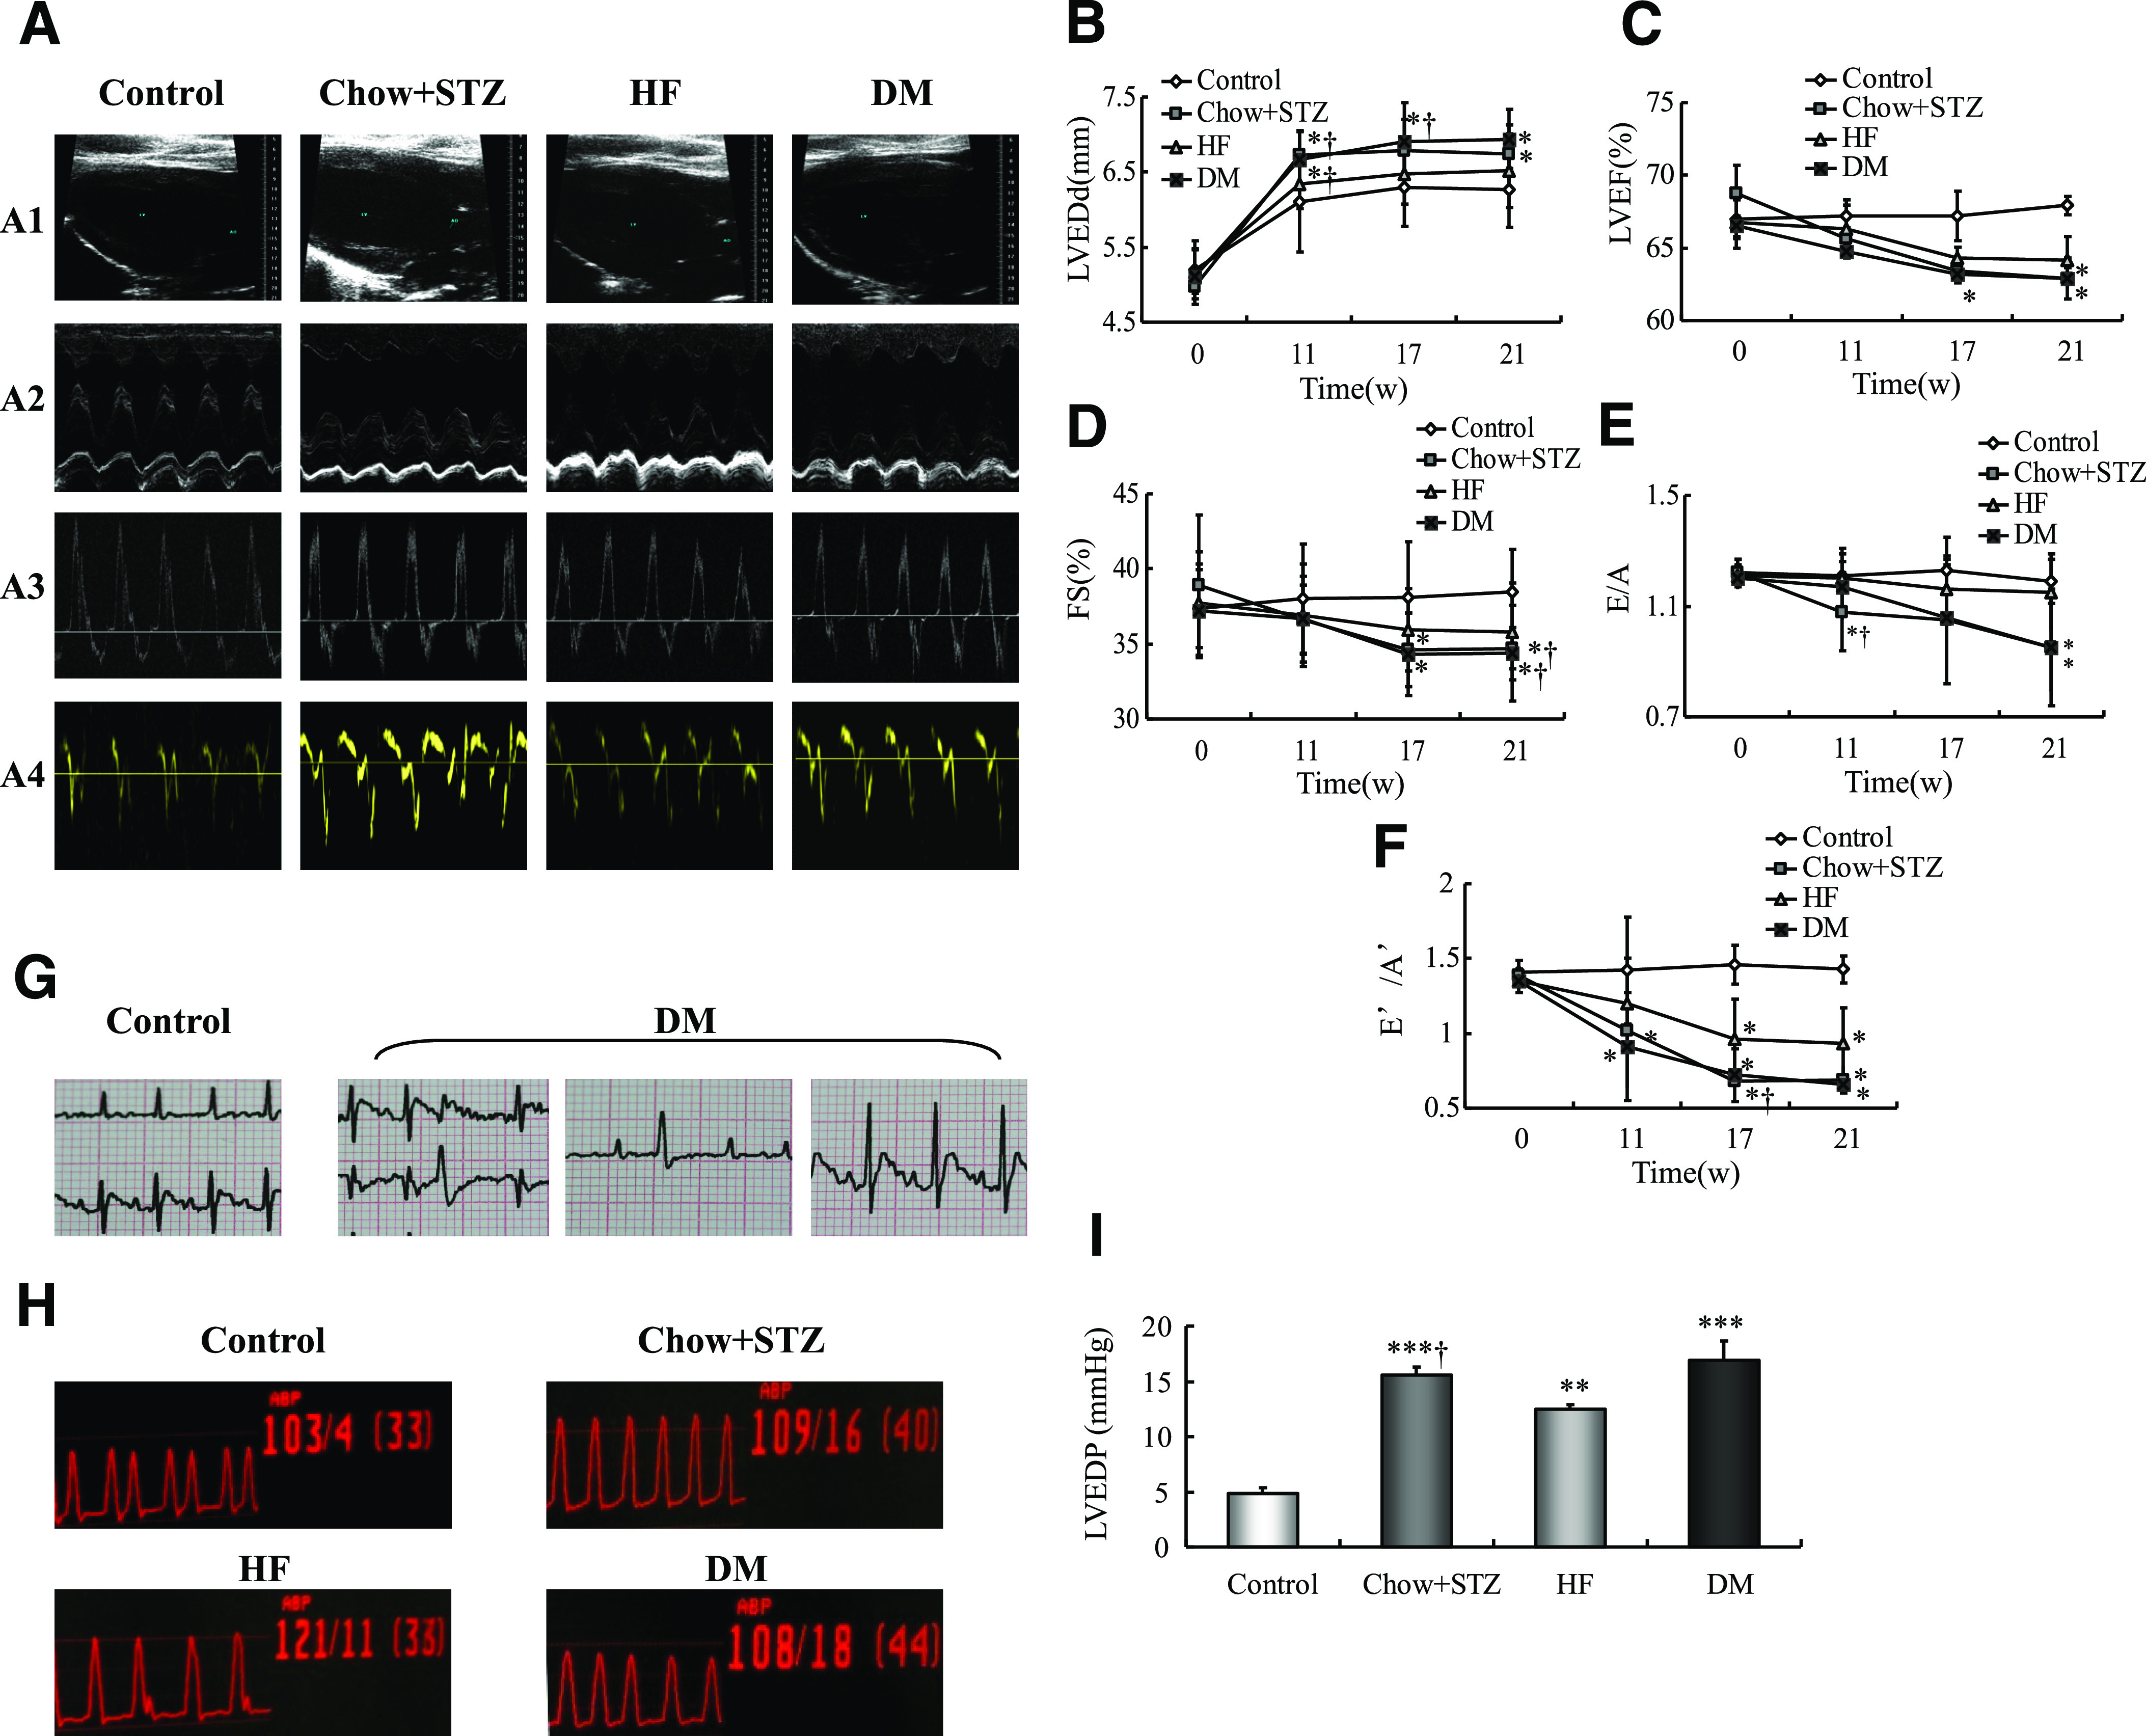
Objective: Tribbles 3 (TRB3) is associated with insulin resistance, an important trigger in the development of diabetic cardiomyopathy (DCM). We sought to determine whether TRB3 plays a major role in modulating DCM and the mechanisms involved.

Research design and methods: The type 2 diabetic rat model was induced by high-fat diet and low-dose streptozotocin. We evaluated the characteristics of type 2 DCM by serial echocardiography and metabolite tests, Western blot analysis for TRB3 expression, and histopathologic analyses of cardiomyocyte density, lipids accumulation, cardiac inflammation, and fibrosis area. We then used gene silencing to investigate the role of TRB3 in the pathophysiologic features of DCM.

Results: Rats with DCM showed severe insulin resistance, left ventricular dysfunction, aberrant lipids deposition, cardiac inflammation, fibrosis, and TRB3 overexpression. We found that the silencing of TRB3 ameliorated metabolic disturbance and insulin resistance; myocardial hypertrophy, lipids accumulation, inflammation, fibrosis, and elevated collagen I-to-III content ratio in DCM rats were significantly decreased. These anatomic findings were accompanied by significant improvements in cardiac function. Furthermore, with TRB3 gene silencing, the inhibited phosphorylation of Akt was restored and the increased phosphorylation of extracellular signal-regulated kinase 1/2 and Jun NH(2)-terminal kinase in DCM was significantly decreased.

Conclusions: TRB3 gene silencing may exert a protective effect on DCM by improving selective insulin resistance, implicating its potential role for treatment of human DCM.


Figures

FIG. 1.
FIG. 1.
Diabetic (DM) rats show metabolic disturbance. A: Total cholesterol (TC) levels. B: Triglyceride (TG) levels. C: FFAs. D: FBG. E: Fasting insulin (FINS). F: ISI. Data are mean ± SEM; n = 7–10 per group. *P < 0.05 vs. control; †P < 0.05 vs. HF; #P < 0.05 vs. chow + STZ. w, weeks.
FIG. 2.
FIG. 2.
Deterioration of cardiac function in diabetic (DM) rats. A1: Representative two-dimensional echocardiograms. A2: Representative M-mode echocardiograms. A3: Representative pulsed-wave Doppler echocardiograms of mitral inflow. A4: Representative tissue Doppler echocardiograms. BF: Sequential evaluations of left ventricular end diastolic diameter (LVEDd) (B), LVEF (C), FS (D), E/A (E), and E′/A′ (F). G: Electrocardiogram of control and DM groups at the end of the experiment. H: Pressure curves of cardiac catheterization. I: Analysis of LVEDP. Data are mean ± SEM; n = 7–10 per group. *P < 0.05, **P < 0.01, ***P < 0.001 vs. control; †P < 0.05 vs. HF. w, weeks. (A high-quality digital representation of this figure is available in the online issue.)
FIG. 3.
FIG. 3.
Pathology features of DCM. Cardiac hypertrophy in diabetic (DM) rats. A1: Heart size (scale bar: 2 mm). A2: Representative cross sections of hearts at the papillary muscle level (scale bar: 2 mm). A3: Longitudinal sections of LV stained with hematoxylin and eosin (H&E; scale bar: 50 μm). A4: Transverse sections of LV stained with H&E (scale bar: 50 μm). B: Quantitative data of heart weight to body weight (HW-to-BW) ratio. C: Morphometric quantification of myocyte size. D: Relative mRNA expression of brain natriuretic protein (BNP). E: Cardiac fibrosis in diabetic rats is shown. Masson trichrome staining (collagen is green and myocardium red; scale bar: 50 μm [E1]) and Picrosirius red staining (collagen fibers stained bright red, bright-field [E2], dark-field [E3]; scale bar: 100 μm) show interstitial fibrosis. Masson trichrome staining (E4) (scale bar: 100 μm) and Picrosirius red staining (bright-field [E5], dark-field [E6]; scale bar: 100 μm) show perivascular fibrosis. F: Quantitative analysis of CVF. G: Collagen content determined by hydroxyproline assay. H: Quantitative analysis of PVCA/LA. Data are mean ± SEM; n = 6. *P < 0.05, **P < 0.01, ***P < 0.001 vs. control; †P < 0.05, ††P < 0.01, ‡P < 0.001 vs. HF; #P < 0.05, ##P < 0.01 vs. chow + STZ. (A high-quality digital representation of this figure is available in the online issue.)
FIG. 4.
FIG. 4.
Diabetic (DM) rats showed excessive myocardial lipids deposition and inflammation. A: Representative Oil Red O–stained myocardial sections (scale bar: 20 μm). B: Semiquantification of Oil Red O staining. Data are mean ± SEM of six independent observations in each group. C and D: Relative mRNA expression of myocardial TNF-α and IL-6. E: Immunohistochemical staining for myocardial TNF-α and IL-6 (brown staining considered positive staining; scale bar: 50 μm). F: Representative Western blot of myocardial TNF-α and IL-6. G and H: Western blot analyses of TNF-α (G) and IL-6 (H). Data are mean ± SEM. *P < 0.05, **P < 0.01, ***P < 0.001 vs. control; ††P < 0.01, ‡P < 0.001 vs. HF; #P < 0.05, ##P < 0.01 vs. chow + STZ. (A high-quality digital representation of this figure is available in the online issue.)
FIG. 5.
FIG. 5.
Diabetes increases collagen I (coll I) and collagen III (coll III) content, suppresses Akt phosphorylation, and partly activates TRB3/MAPK pathway. A: Representative immunohistochemical staining of collagen I and III (brown staining considered positive staining; scale bar: 50 μm). B: Representative Western blot of collagen I and III content. C: Western blot analysis of collagen I, collagen III, and collagen I-to-III ratio. D: Relative mRNA expression and protein content of myocardial TRB3. E: Western blot analysis of p-Akt/Akt, p-ERK/ERK, p-p38/p38, and p-JNK/JNK. Data are mean ± SEM. *P < 0.05, **P < 0.01, ***P < 0.001 vs. control; †P < 0.05, ††P < 0.01, ‡P < 0.001 vs. HF; #P < 0.05, ##P < 0.01, ###P < 0.001 vs. chow + STZ. DM, diabetic rats. (A high-quality digital representation of this figure is available in the online issue.)
FIG. 6.
FIG. 6.
TRB3 gene therapy improves cardiac function in diabetic (DM) rats. A: Relative mRNA expression and protein content of myocardial TRB3 in gene-silencing groups. B: Representative echocardiograms. CG: Sequential evaluations of left ventricular end diastolic diameter (LVEDd) (C), FS (D), LVEF (E), E/A (F), and E′/A′ (G). H: Pressure curves of cardiac catheterization. I: Analysis of LVEDP with TRB3-siRNA silencing. Data are mean ± SEM; n = 7–10 per group. §P < 0.05, §§P < 0.01 vs. DM + vehicle. w, weeks. (A high-quality digital representation of this figure is available in the online issue.)
FIG. 7.
FIG. 7.
TRB3 gene therapy decreases myocardial hypertrophy and fibrosis in HF and diabetic (DM) groups. A1: Heart size (scale bar: 2 mm). A2: Representative cross sections of hearts at the papillary muscle level (scale bar: 2 mm). A3: Longitudinal sections of LV stained with hematoxylin and eosin (H&E) (scale bar: 50 μm). A4: Transverse section of LV stained with H&E (scale bar: 50 μm). BD: Quantitative data for heart weight to body weight (HW-to-BW) ratio, myocyte size, and relative brain natriuretic protein (BNP) mRNA expression. E1–6: Representative Masson trichrome staining and Picrosirius red staining. FH: Quantitative analyses of CVF, collagen content, and PVCA/LA. Data are mean ± SEM; n = 7–10 per group. (A high-quality digital representation of this figure is available in the online issue.)
FIG. 8.
FIG. 8.
TRB3 gene silencing decreases aberrant lipid accumulation and cardiac inflammation. A: Representative Oil Red O–stained myocardial sections (scale bar: 20 μm). B: Semiquantification of Oil Red O staining. Data are mean ± SEM of six independent observations in each group. C and D: Relative mRNA expression of myocardial TNF-α and IL-6. E: Immunohistochemical staining for myocardial TNF-α and IL-6 (brown staining considered positive staining; scale bar: 50 μm). F: Representative Western blot of myocardial TNF-α and IL-6. G and H: Western blot analyses of TNF-α (G) and IL-6 (H). Data are mean ± SEM. DM, diabetic rats. (A high-quality digital representation of this figure is available in the online issue.)
FIG. 9.
FIG. 9.
TRB3 gene silencing decreases collagen expression, restores the phosphorylation of p-Akt, and partly reverses MAPK activation. A: Representative immunohistochemical staining showing collagen I and III (scale bar: 50 μm). B: Representative Western blot of collagen I and III. C: Western blot analyses of collagen I and III content and collagen I-to-III ratio. D: Western blot analysis of p-Akt/Akt, p-ERK/ERK, p-p38/p38MAPK, and p-JNK/JNK. Data are mean ± SEM. DM, diabetic rats. (A high-quality digital representation of this figure is available in the online issue.)

References

    1. Poornima IG, Parikh P, Shannon RP. Diabetic cardiomyopathy: the search for a unifying hypothesis. Circ Res 2006;98:596–605 - PubMed
    1. Young ME, Guthrie PH, Razeghi P, et al. . Impaired long-chain fatty acid oxidation and contractile dysfunction in the obese Zucker rat heart. Diabetes 2002;51:2587–2595 - PubMed
    1. Witteles RM, Fowler MB. Insulin-resistant cardiomyopathy clinical evidence, mechanisms, and treatment options. J Am Coll Cardiol 2008;51:93–102 - PubMed
    1. Yang ZH, Peng XD. Insulin resistance and heart injury in rats with insulin resistance or type 2 diabetes mellitus. Acta Cardiol 2010;65:329–335 - PubMed
    1. Iacobellis G, Ribaudo MC, Zappaterreno A, et al. . Relationship of insulin sensitivity and left ventricular mass in uncomplicated obesity. Obes Res 2003;11:518–524 - PubMed

Publication types

MeSH terms