. 2011 Sep;23(9):3137-55.
doi: 10.1105/tpc.111.088906. Epub 2011 Sep 20.

Nonessential plastid-encoded ribosomal proteins in tobacco: a developmental role for plastid translation and implications for reductive genome evolution

Affiliations

Nonessential plastid-encoded ribosomal proteins in tobacco: a developmental role for plastid translation and implications for reductive genome evolution

Tobias T Fleischmann et al. Plant Cell. 2011 Sep.

Abstract

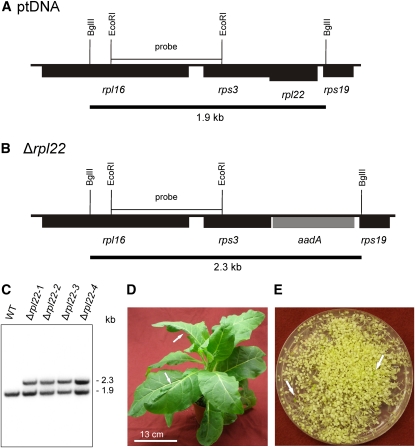
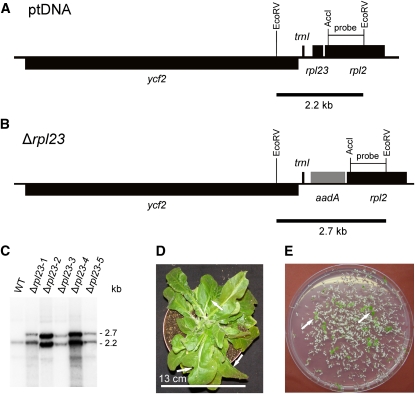
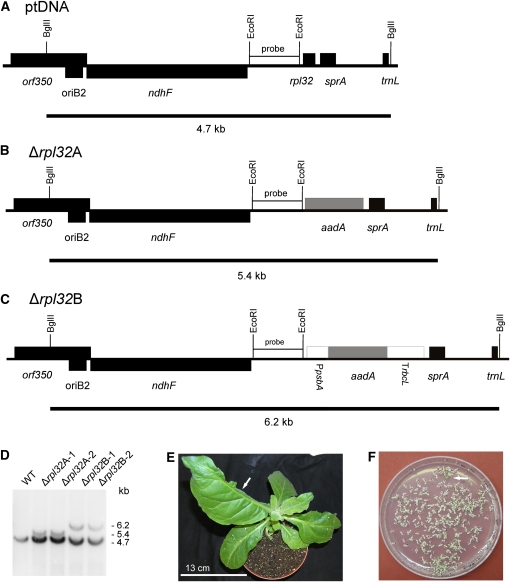
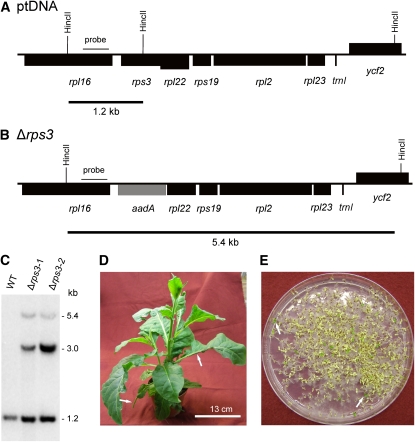
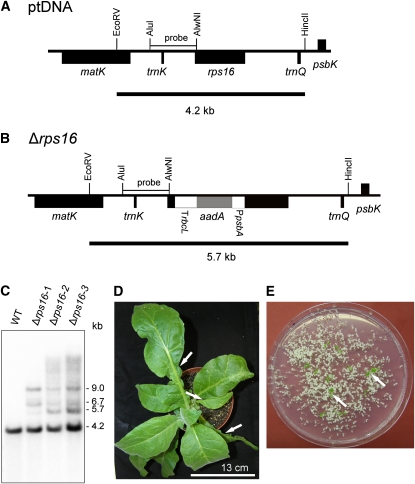
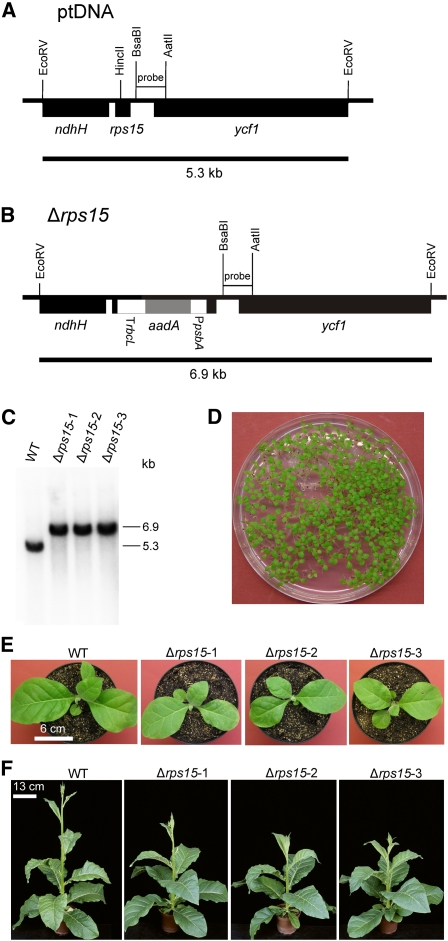
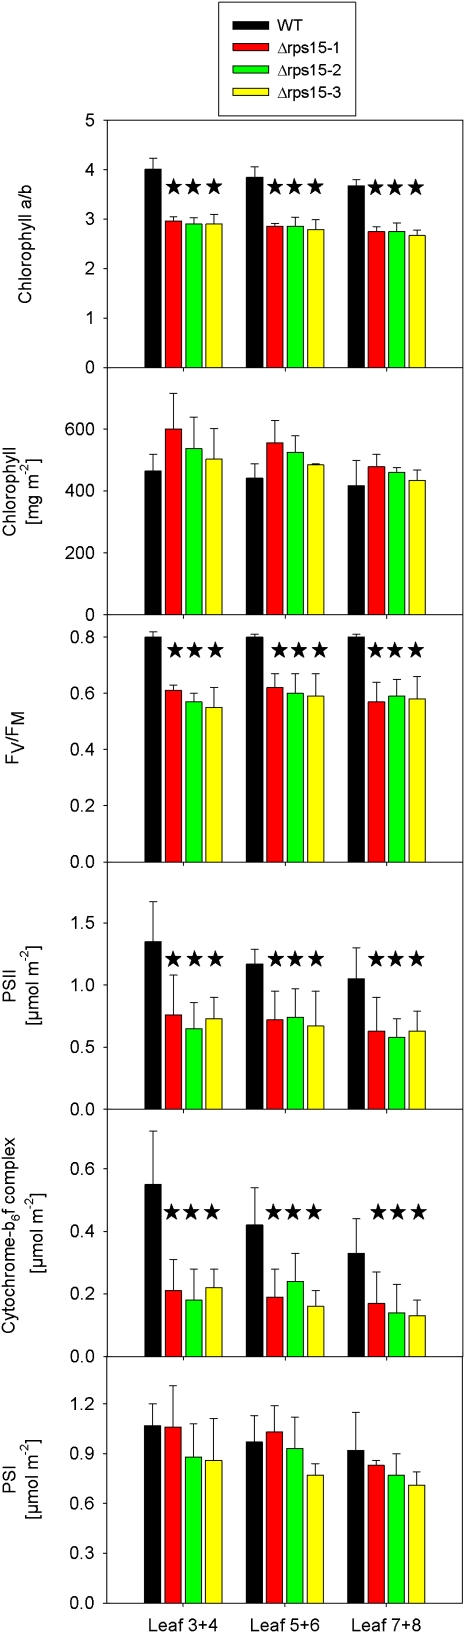
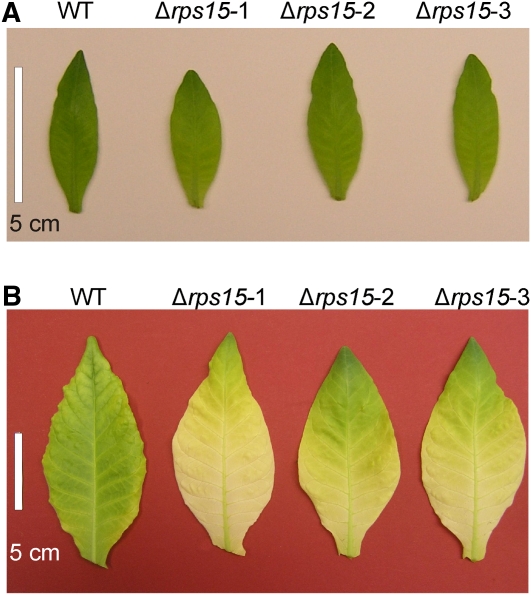
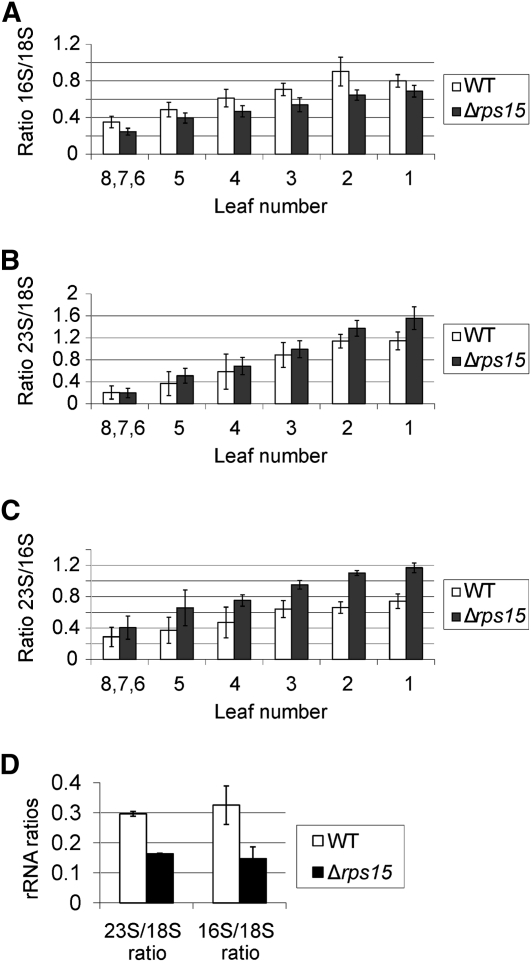
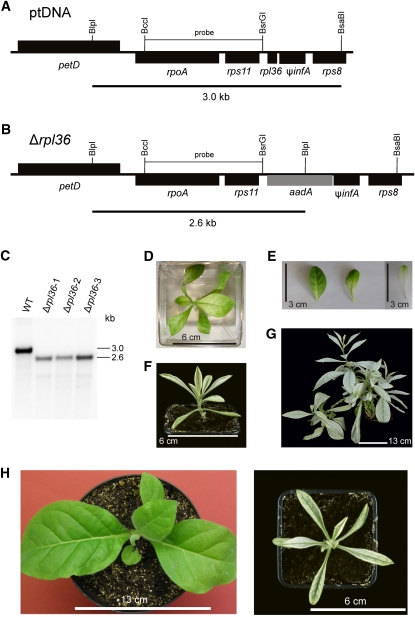
Plastid genomes of higher plants contain a conserved set of ribosomal protein genes. Although plastid translational activity is essential for cell survival in tobacco (Nicotiana tabacum), individual plastid ribosomal proteins can be nonessential. Candidates for nonessential plastid ribosomal proteins are ribosomal proteins identified as nonessential in bacteria and those whose genes were lost from the highly reduced plastid genomes of nonphotosynthetic plastid-bearing lineages (parasitic plants, apicomplexan protozoa). Here we report the reverse genetic analysis of seven plastid-encoded ribosomal proteins that meet these criteria. We have introduced knockout alleles for the corresponding genes into the tobacco plastid genome. Five of the targeted genes (ribosomal protein of the large subunit22 [rpl22], rpl23, rpl32, ribosomal protein of the small subunit3 [rps3], and rps16) were shown to be essential even under heterotrophic conditions, despite their loss in at least some parasitic plastid-bearing lineages. This suggests that nonphotosynthetic plastids show elevated rates of gene transfer to the nuclear genome. Knockout of two ribosomal protein genes, rps15 and rpl36, yielded homoplasmic transplastomic mutants, thus indicating nonessentiality. Whereas Δrps15 plants showed only a mild phenotype, Δrpl36 plants were severely impaired in photosynthesis and growth and, moreover, displayed greatly altered leaf morphology. This finding provides strong genetic evidence that chloroplast translational activity influences leaf development, presumably via a retrograde signaling pathway.


Figures

Figure 1.
Figure 1.
Targeted Inactivation of the rpl22 Gene Encoding Plastid Ribosomal Protein L22. (A) Physical map of the region in the tobacco plastid genome (ptDNA) (Shinozaki et al., 1986) containing the rpl22 gene. Genes below the line are transcribed from the right to the left. (B) Map of the transformed plastid genome (transplastome) produced with plastid transformation vector pΔrpl22. The selectable marker gene aadA (Svab and Maliga, 1993) replaces rpl22 in the operon of ribosomal protein genes. Restriction sites used for cloning, RFLP analysis, and/or generation of hybridization probes are indicated. Expected sizes of restriction fragments detected by hybridization are indicated by black bars below the maps. (C) RFLP analysis of four plastid transformants. All lines are heteroplasmic and show the 1.9-kb wild type–specific hybridization band in addition to the 2.3-kb band diagnostic of the transplastome. WT, wild type. (D) Phenotype of a typical (heteroplasmic) Δrpl22 transplastomic plant. Arrows point to examples of misshapen leaves that lack part of the leaf blade. (E) Segregation of the rpl22 knockout allele in the progeny from a parent plant grown without antibiotic selection as determined by seed germination assays on synthetic medium containing spectinomycin. The transplastome is lost from most seedlings as evidenced by their white (antibiotic-sensitive) phenotype. Occasional green spectinomycin-resistant seedlings are indicated by arrows. Bar in (D) = 13 cm.
Figure 2.
Figure 2.
Targeted Inactivation of the rpl23 Gene Encoding Plastid Ribosomal Protein L23. (A) Physical map of the region in the tobacco plastid genome containing the rpl23 gene. Genes above the line are transcribed from the left to the right, genes below the line are transcribed in the opposite direction. (B) Map of the transformed plastid genome produced with plastid transformation vector pΔrpl23. The selectable marker gene aadA replaces the rpl23 gene in the operon of ribosomal protein genes. Restriction sites used for cloning, RFLP analysis, and/or generation of hybridization probes are indicated. Expected sizes of restriction fragments detected by hybridization are indicated by black bars below the maps. (C) RFLP analysis of five plastid transformants. All lines are heteroplasmic and show the 2.3-kb wild type–specific hybridization band in addition to the 2.7-kb band diagnostic of the transplastome. WT, wild type. (D) Phenotype of a typical (heteroplasmic) Δrpl23 transplastomic plant. Arrows point to examples of misshapen leaves that lack part of the leaf blade. (E) Segregation of the rpl23 knockout allele in the progeny as determined by seed germination assays on synthetic medium containing spectinomycin. Two examples of green antibiotic-resistant seedlings (that still contain the transplastome) are denoted by arrows. Bar in (D) = 13 cm.
Figure 3.
Figure 3.
Targeted Inactivation of the rpl32 Gene Encoding Plastid Ribosomal Protein L32. (A) Physical map of the region in the tobacco plastid genome containing the rpl32 gene. Transcriptional orientations and labeling of restriction sites, hybridization probes, and hybridizing fragments are as in Figure 2. (B) Map of the transformed plastid genome produced with plastid transformation vector pΔrpl32A. In this vector, the selectable marker gene aadA replaces the rpl32 gene and is driven by the native promoter upstream of rpl32. (C) Map of the transformed plastid genome produced with plastid transformation vector pΔrpl32B. In this vector, a chimeric selectable marker gene cassette was used to replace the rpl32 gene. It consists of the promoter of the plastid psbA gene, the coding region of the aadA marker and the 3′ UTR derived from the rbcL gene. (D) RFLP analysis of four plastid transformants. All lines are heteroplasmic and show the 4.7-kb wild type–specific hybridization band. The transplastomes give the expected 5.4-kb band (Δrpl32A) or 6.2-kb band (Δrpl32B). WT, wild type. (E) Phenotype of a typical (heteroplasmic) Δrpl32 transplastomic plant. The arrow points to a misshapen leaf that lacks almost half of the leaf blade. (F) Segregation of the rpl32 knockout allele in the progeny as determined by seed germination assays on synthetic medium containing spectinomycin. A single green antibiotic-resistant seedling (that still contains the transplastome) is marked by the arrow. Bar in (E) = 13 cm.
Figure 4.
Figure 4.
Targeted Inactivation of the rps3 Gene Encoding Plastid Ribosomal Protein S3. (A) Physical map of the region in the tobacco plastid genome containing the rps3 gene. Transcriptional orientations and labeling of restriction sites, hybridization probes, and hybridizing fragments are as in Figure 2. (B) Map of the transformed plastid genome produced with plastid transformation vector pΔrps3. The selectable marker gene aadA replaces the rps3 gene (residing in an operon with many other ribosomal protein genes). (C) RFLP analysis of two plastid transformants. Both lines are heteroplasmic and show the 1.2-kb wild type–specific hybridization band in addition to the 5.4-kb band diagnostic of the transplastome. The 3.0-kb band corresponds in size to the fragment expected for the co-integrate (resulting from single crossover integration) and was not further characterized. WT, wild type. (D) Phenotype of a typical (heteroplasmic) Δrps3 transplastomic plant. Arrows point to examples of misshapen leaves that lack parts of the leaf blade. (E) Segregation of the rps3 knockout allele in the progeny as determined by seed germination assays on synthetic medium containing spectinomycin. Two examples of green antibiotic-resistant seedlings (that still contain the transplastome) are indicated by arrows. Bar in (D) = 13 cm.
Figure 5.
Figure 5.
Targeted Disruption of the rps16 Gene Encoding Plastid Ribosomal Protein S16. (A) Physical map of the region in the tobacco plastid genome containing the rps16 gene. Transcriptional orientations and labeling of restriction sites, hybridization probes, and hybridizing fragments are as in Figure 2. (B) Map of the transformed plastid genome produced with plastid transformation vector pΔrps16. The aadA cassette disrupts the rps16 gene. (C) RFLP analysis of three plastid transformants. All lines are heteroplasmic and show the 4.2-kb wild type (WT)–specific hybridization band in addition to the 5.7-kb band diagnostic of the transplastome. Additional larger hybridizing bands are most likely the products of recombination events between homologous expression signals (Rogalski et al., 2006; Rogalski et al., 2008a). They were reproducibly observed in several independent experiments, do not match expected patterns for partial restriction enzyme digestion, and were not further characterized. (D) Phenotype of a typical (heteroplasmic) Δrps16 transplastomic plant. Arrows point to examples of misshapen leaves that lack parts of their leaf blade. (E) Segregation of the rps16 knockout allele in the progeny as determined by seed germination assays on synthetic medium containing spectinomycin. Two examples of green antibiotic-resistant seedlings (that still contain the transplastome) are indicated by arrows. Bar in (D) = 13 cm.
Figure 6.
Figure 6.
Knockout of the rps15 Gene Encoding Plastid Ribosomal Protein S15. (A) Physical map of the region in the tobacco plastid genome containing the rps15 gene. Transcriptional orientations and labeling of restriction sites, hybridization probes, and hybridizing fragments are as in Figure 2. (B) Map of the transformed plastid genome produced with plastid transformation vector pΔrps15. The aadA cassette disrupts the rps15 gene. (C) RFLP analysis of three plastid transformants. All transplastomic lines are homoplasmic and show exclusively the 6.9-kb band diagnostic of the transplastome. WT, wild type. (D) Confirmation of homoplasmy by segregation assays. Germination of seeds on synthetic medium containing spectinomycin results in a homogeneous population of green antibiotic-resistant seedlings. (E) Phenotype of Δrps15 transplastomic plants after growth for 3 weeks at 100 μE m−2 s−1. (F) Phenotype of Δrps15 transplastomic plants after growth for 8 weeks at 100 μE m−2 s−1 followed by growth for 2 weeks at 350 μE m−2 s−1. Bar in (E) = 6 cm; bar in (F) = 13 cm.
Figure 7.
Figure 7.
Analysis of Chlorophyll Contents and Various Photosynthetic Parameters in Δrps15 Transplastomic Knockout Mutants and Wild-Type Control Plants. Data sets are shown for plants grown under 100 μE m−2 s−1 for 8 weeks followed by 2 weeks of growth under 350 μE m−2 s−1. To capture possible changes during development, pairs of leaves (numbered from the top to the bottom of the plant) were analyzed. For each plant line, three different plants were measured, and data were subjected to one-way analysis of variance using a pair-wise multiple comparison procedure (Holm-Sidak method) in SigmaPlot. Highly significant differences are indicated by stars (P < 0.001). Error bars represent the sd. FV/FM represents the maximum quantum efficiency of PSII in the dark-adapted state. Photosynthetic complexes were quantified from difference absorbance measurements of cytochrome b559 (PSII), cytochromes b6 and f, and P700 (PSI) in isolated thylakoids. WT, wild type.
Figure 8.
Figure 8.
Leaf Pigmentation Phenotypes in Δrps15 Transplastomic Plants. (A) Young leaves of Δrps15 transplastomic plants are slightly paler than the wild-type (WT) leaves when grown under 100 μE m−2 s−1 at 26°C. (B) Leaves of Δrps15 plants grown under cold stress conditions for 65 d show a much more severe pigment loss than the wild-type leaves. Bars = 5 cm.
Figure 9.
Figure 9.
Accumulation of rRNAs as a Proxy for the Corresponding Ribosomal Subunits in the Wild-Type and Δrps15 Plants. (A) Ratio of the plastid 16S rRNA to the cytosolic 18S rRNA. To capture possible changes during development, a developmental series of leaves (numbered from the bottom to the top of the plant) was analyzed for each plant. Leaves numbered 6, 7, and 8 correspond to the youngest leaves, which had to be pooled due to their small size. For each line, three different plants were measured with two technical replicates each. The error bars indicate the sd. (B) Ratio of the plastid 23S rRNA to the cytosolic 18S rRNA. (C) Ratio of the plastid 23S rRNA to the plastid 16S rRNA. (D) 23S rRNA:18S rRNA ratio and 16S:18S rRNA ratio in leaves of Δrps15 transplastomic plants and the wild-type plants grown under cold stress conditions (Figure 8). WT, wild type.
Figure 10.
Figure 10.
Analysis of Translation in Δrps15 Plants. (A) to (D) Analysis of rRNA distribution in polysome preparations from young leaves (numbers 8, 7, and 6; Figure 9) and old leaves (number 1) of the wild-type (WT) and mutant plants. Polysomes were separated in Suc gradients, and each gradient was fractionated into 10 fractions (numbered from the top to the bottom) as indicated above the panels. (A) Ethidium bromide-stained agarose gels prior to blotting. (B) Comparison of polysome association of psaA and psbD transcripts in the wild-type and Δrps15 transplastomic plants. Young and old leaves are compared for both genes. (C) As a control, polysomes were isolated in the presence of the polysome-dissociating antibiotic puromycin, blotted, and hybridized to the psaA probe (Bottom). For analysis of rRNA distribution, an ethidium bromide-stained agarose gel prior to blotting is also shown (Top). (D) Analysis of polysome association of psaA and psbD transcripts in leaves of plants grown under cold stress conditions. The gradient fractions containing the bulk of the transcripts are indicated by brackets.
Figure 11.
Figure 11.
Knockout of the rpl36 Gene Encoding Plastid Ribosomal Protein L36. (A) Physical map of the region in the tobacco plastid genome containing the rpl36 gene. Transcriptional orientations and labeling of restriction sites, hybridization probes, and hybridizing fragments are as in Figure 2. (B) Map of the transformed plastid genome produced with plastid transformation vector pΔrpl36. The aadA gene replaces rpl36 in the large operon of ribosomal protein genes. (C) RFLP analysis of three plastid transformants. All transplastomic lines are homoplasmic and show exclusively the 2.6-kb band diagnostic of the transplastome. WT, wild type. (D) Phenotype of a Δrpl36 transplastomic plant grown on Suc-containing synthetic medium for 3 months under low-light conditions (5 μE m−2 s−1). (E) Greening of Δrpl36 leaves after plant transfer from medium-light to low-light conditions. The left two leaves are from a plant 4 weeks after transfer from 55 to 5 μE m−2 s−1, and the right leaf is from a plant continuously grown under 55 μE m−2 s−1. (F) Phenotype of a Δrpl36 transplastomic plant growing in soil 2 months after transfer to the greenhouse. (G) The same plant after 1.3 years. Note the atypical extensive branching. (H) Severely altered leaf shape in Δrpl36 transplastomic knockout mutants. A wild-type plant (left) is compared with a transplastomic plant at approximately the same developmental stage. Bars in (D) and (F) = 6 cm; bar in (E) = 3 cm; bar in (G) 13 cm; bar in (H) at left = 13 cm and at right = 6 cm.

Similar articles

Cited by

References

    1. Ahlert D., Ruf S., Bock R. (2003). Plastid protein synthesis is required for plant development in tobacco. Proc. Natl. Acad. Sci. USA 100: 15730–15735 - PMC - PubMed
    1. Albrecht V., Ingenfeld A., Apel K. (2006). Characterization of the snowy cotyledon 1 mutant of Arabidopsis thaliana: The impact of chloroplast elongation factor G on chloroplast development and plant vitality. Plant Mol. Biol. 60: 507–518 - PubMed
    1. Baba T., Ara T., Hasegawa M., Takai Y., Okumura Y., Baba M., Datsenko K.A., Tomita M., Wanner B.L., Mori H. (2006). Construction of Escherichia coli K-12 in-frame, single-gene knockout mutants: The Keio collection. Mol. Syst. Biol. 2: 2006, 0008 10.1038/msb4100050 - PMC - PubMed
    1. Barbrook A.C., Howe C.J., Purton S. (2006). Why are plastid genomes retained in nonphotosynthetic organisms? Trends Plant Sci. 11: 101–108 - PubMed
    1. Barkan A. (1988). Proteins encoded by a complex chloroplast transcription unit are each translated from both monocistronic and polycistronic mRNAs. EMBO J. 7: 2637–2644 - PMC - PubMed

Publication types

LinkOut - more resources