. 2011 Sep 12;19(19):18636-44.
doi: 10.1364/OE.19.018636.

Contrast enhanced high-resolution diffuse optical tomography of the human brain using ICG

Affiliations

Contrast enhanced high-resolution diffuse optical tomography of the human brain using ICG

Christina Habermehl et al. Opt Express. .

Abstract

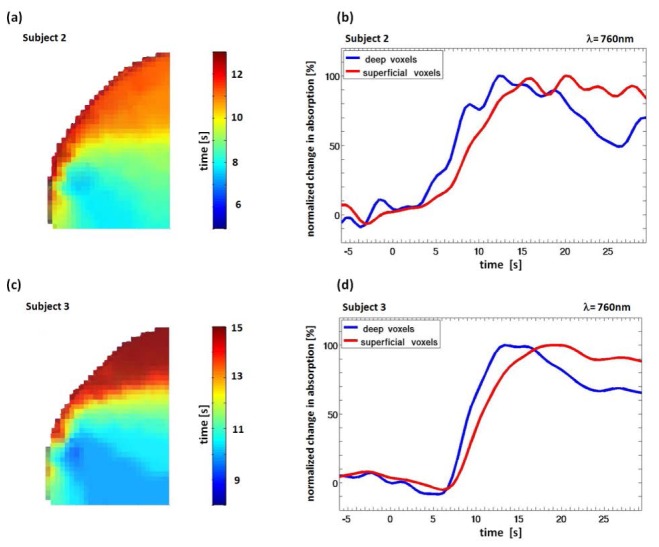
Non-invasive diffuse optical tomography (DOT) of the adult brain has recently been shown to improve the spatial resolution for functional brain imaging applications. Here we show that high-resolution (HR) DOT is also advantageous for clinical perfusion imaging using an optical contrast agent. We present the first HR-DOT results with a continuous wave near infrared spectroscopy setup using a dense grid of optical fibers and indocyanine green (ICG) as an exogenic contrast agent. We find an early arrival of the ICG bolus in the intracerebral tissue and a delayed arrival of the bolus in the extracerebral tissue, achieving the separation of both layers. This demonstrates the method's potential for brain perfusion monitoring in neurointensive care patients.


Figures

Fig. 1
Fig. 1
Imaging setup. (a) Absorption changes were measured with a DOT imaging system (DYNOT, NIRx Medizintechnik GmbH, Berlin, Germany) (b) A 5x6 fiber grid with 30 co-located sources and detectors was placed pericentrally over the right hemisphere. (c), (d) Finite element mesh that was used for image reconstruction of relative absorption changes. Red dots indicate the positions of the optical fibers in the forward geometry.
Fig. 2
Fig. 2
Normalized detector readings following an ICG bolus (subject 1, λ = 760 nm). Red lines indicate the time course of all 1st NN combinations (SD distance 7.5 mm). Blue lines represent the time course for all 3rd NN combinations (SD distance 22.5 mm). The average of all 1st NN and 3rd NN time courses is given in bold. Box in the left corner depicts the fiber grid set-up and the channels taken for the different time courses.
Fig. 3
Fig. 3
(a) Single frames from a video ( Media 1), depicting the frontal view on the reconstructed result volume (subject 1, 1st ICG bolus and λ = 760 nm). Green voxels indicate increased absorption. Voxels are colored semi-transparent, bolus injection was at t = 0-1 s. (b) Same view on the reconstructed result volume as in (a), displaying for each voxel the time (in s after bolus injection) when 50% of the maximum absorption value was reached. (c) Transversal slice from an anatomical scan of the used forward model geometry.
Fig. 4
Fig. 4
Time courses of normalized relative absorption changes for subject 1 and both boli and wavelengths. Red lines represent the averaged intensity values from superficial voxels; blue lines represent intensity values from voxels from deeper (cortical) layers. Injection of the ICG bolus was at t = 0-1s. Note, that due to manual injection, this time point is only an approximation. (a) 1st ICG bolus, λ = 760 nm. (b) 1st bolus, λ = 830 nm. (c) 2nd bolus, λ = 760 nm. (d) 2nd bolus, λ = 830 nm.
Fig. 5
Fig. 5
(a) Subject 2. Frontal view on the reconstruction volume, color-coded voxels depict the time (in s after bolus injection (t = 0-3 s)) when 50% of the maximum absorption value was reached. (b) Subject 2, reconstructed time courses for deep and superficial voxels for λ = 760 nm. (c), (d) Same as (a), (b) but for subject 3.
Fig. 6
Fig. 6
Single frames from a video ( Media 2) of a lateral view on a 10 mm thick slice (60 x 60 mm wide) of superficial layers for subject 1, the 1st ICG bolus and λ = 760 nm. Green voxels indicate increased absorption.

References

    1. Hopton P., Walsh T. S., Lee A., “Measurement of cerebral blood volume using near-infrared spectroscopy and indocyanine green elimination,” J. Appl. Physiol. 87(5), 1981–1987 (1999). - PubMed
    1. Keller E., Nadler A., Alkadhi H., Kollias S. S., Yonekawa Y., Niederer P., “Noninvasive measurement of regional cerebral blood flow and regional cerebral blood volume by near-infrared spectroscopy and indocyanine green dye dilution,” Neuroimage 20(2), 828–839 (2003).10.1016/S1053-8119(03)00315-X - DOI - PubMed
    1. Terborg C., Bramer S., Harscher S., Simon M., Witte O. W., “Bedside assessment of cerebral perfusion reductions in patients with acute ischaemic stroke by near-infrared spectroscopy and indocyanine green,” J. Neurol. Neurosurg. Psychiatry 75(1), 38–42 (2004). - PMC - PubMed
    1. Terborg C., Gröschel K., Petrovitch A., Ringer T., Schnaudigel S., Witte O. W., Kastrup A., “Noninvasive assessment of cerebral perfusion and oxygenation in acute ischemic stroke by near-infrared spectroscopy,” Eur. Neurol. 62(6), 338–343 (2009).10.1159/000239794 - DOI - PubMed
    1. Liebert A., Wabnitz H., Obrig H., Erdmann R., Möller M., Macdonald R., Rinneberg H., Villringer A., Steinbrink J., “Non-invasive detection of fluorescence from exogenous chromophores in the adult human brain,” Neuroimage 31(2), 600–608 (2006).10.1016/j.neuroimage.2005.12.046 - DOI - PubMed

Publication types