

Effect of loading conditions on the dissociation behaviour of catch bond clusters
- PMID: 21937488
- PMCID: PMC3306648
- DOI: 10.1098/rsif.2011.0553
Effect of loading conditions on the dissociation behaviour of catch bond clusters
Abstract
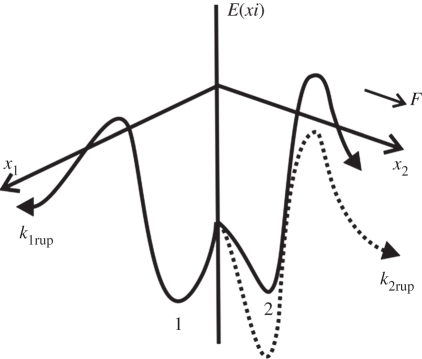
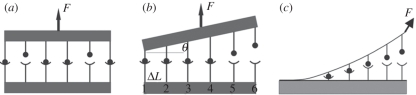
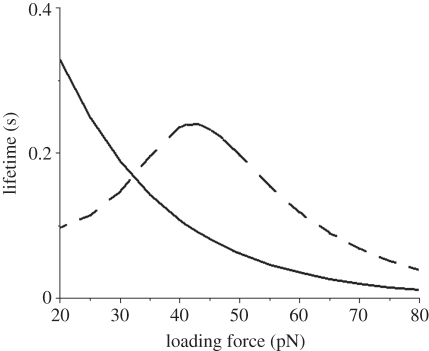
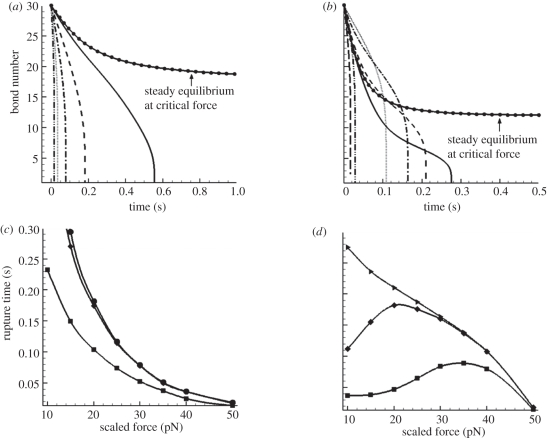
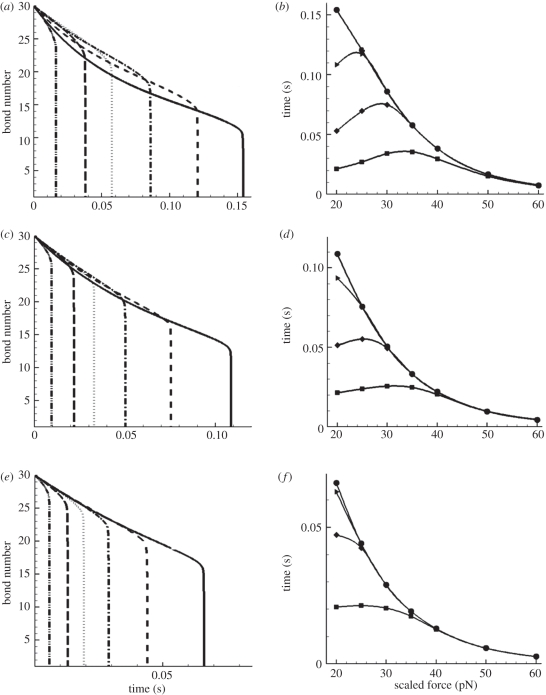
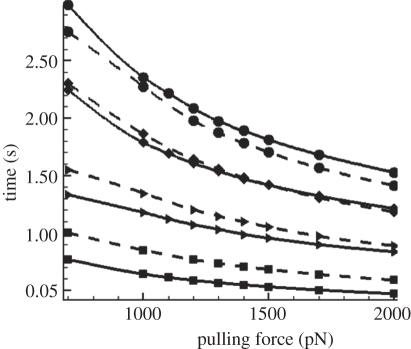
Under increasing tensile load, the lifetime of a single catch bond counterintuitively increases up to a maximum and then decreases exponentially like a slip bond. So far, the characteristics of single catch bond dissociation have been extensively studied. However, it remains unclear how a cluster of catch bonds behaves under tensile load. We perform computational analysis on the following models to examine the characteristics of clustered catch bonds: (i) clusters of catch bonds with equal load sharing, (ii) clusters of catch bonds with linear load sharing, and (iii) clusters of catch bonds in micropipette-manipulated cell detachment. We focus on the differences between the slip and catch bond clusters, identifying the critical factors for exhibiting the characteristics of catch bond mechanism for the multiple-bond system. Our computation reveals that for a multiple-bond cluster, the catch bond behaviour could only manifest itself under relatively uniform loading conditions and at certain stages of decohesion, explaining the difficulties in observing the catch bond mechanism under real biological conditions.
Figures

Similar articles
-
Contractile fibers and catch-bond clusters: a biological force sensor?Biophys J. 2013 Sep 17;105(6):1336-45. doi: 10.1016/j.bpj.2013.07.039. Biophys J. 2013. PMID: 24047984 Free PMC article.
-
Theoretical aspects of the biological catch bond.Acc Chem Res. 2009 Jun 16;42(6):693-703. doi: 10.1021/ar800202z. Acc Chem Res. 2009. PMID: 19331389 Review.
-
Entropic-elasticity-controlled dissociation and energetic-elasticity-controlled rupture induce catch-to-slip bonds in cell-adhesion molecules.Phys Rev E Stat Nonlin Soft Matter Phys. 2008 Mar;77(3 Pt 1):031910. doi: 10.1103/PhysRevE.77.031910. Epub 2008 Mar 11. Phys Rev E Stat Nonlin Soft Matter Phys. 2008. PMID: 18517425
-
Biophysics of catch bonds.Annu Rev Biophys. 2008;37:399-416. doi: 10.1146/annurev.biophys.37.032807.125804. Annu Rev Biophys. 2008. PMID: 18573088 Review.
-
Rupture of multiple catch-slip bonds: Two-state two-pathway catch-slip bonds.Eur Phys J E Soft Matter. 2013 Nov;36(11):133. doi: 10.1140/epje/i2013-13133-9. Epub 2013 Nov 26. Eur Phys J E Soft Matter. 2013. PMID: 24272665
Cited by
-
Probing time-dependent mechanical behaviors of catch bonds based on two-state models.Sci Rep. 2015 Jan 19;5:7868. doi: 10.1038/srep07868. Sci Rep. 2015. PMID: 25598078 Free PMC article.
-
Cell Shape and Durotaxis Explained from Cell-Extracellular Matrix Forces and Focal Adhesion Dynamics.iScience. 2020 Aug 22;23(9):101488. doi: 10.1016/j.isci.2020.101488. eCollection 2020 Sep 25. iScience. 2020. PMID: 32896767 Free PMC article.
-
Controlling Cellular Volume via Mechanical and Physical Properties of Substrate.Biophys J. 2018 Feb 6;114(3):675-687. doi: 10.1016/j.bpj.2017.11.3785. Biophys J. 2018. PMID: 29414713 Free PMC article.
-
Contractile fibers and catch-bond clusters: a biological force sensor?Biophys J. 2013 Sep 17;105(6):1336-45. doi: 10.1016/j.bpj.2013.07.039. Biophys J. 2013. PMID: 24047984 Free PMC article.
-
How Do We Know when Single-Molecule Force Spectroscopy Really Tests Single Bonds?Biophys J. 2018 May 8;114(9):2032-2039. doi: 10.1016/j.bpj.2018.04.002. Biophys J. 2018. PMID: 29742396 Free PMC article. Review.
References
-
- Evans E. 2001. Probing the relation between force—lifetime—and chemistry in single molecular bonds. Annu. Rev. Biophys. Biomol. Struct. 30, 105–12810.1146/annurev.biophys.30.1.105 (doi:10.1146/annurev.biophys.30.1.105) - DOI - DOI - PubMed
-
- Hammer D. A., Tirrel M. 1996. Biological adhesion at interfaces. Annu. Rev. Mater. Sci. 26, 651–69110.1146/annurev.ms.26.080196.003251 (doi:10.1146/annurev.ms.26.080196.003251) - DOI - DOI
-
- Marshall B. T., Long M., Piper J. W., Yago T., McEver R. P., Zhu C. 2003. Direct observation of catch bonds involving cell-adhesion molecules. Nature 423, 190–19310.1038/nature01605 (doi:10.1038/nature01605) - DOI - DOI - PubMed
-
- Barsegov V., Thirumalai D. 2005. Dynamics of unbinding of cell adhesion molecules: transition from catch to slip bonds. Proc. Natl Acad. Sci. USA 102, 1835–183910.1073/pnas.0406938102 (doi:10.1073/pnas.0406938102) - DOI - DOI - PMC - PubMed
-
- Prezhdo O. V., Perverzev Y. V. 2009. Theoretical aspects of the biological catch-bond. Acc. Chem. Res. 42, 693–70310.1021/ar800202z (doi:10.1021/ar800202z) - DOI - DOI - PubMed
MeSH terms
Substances
LinkOut - more resources
Full Text Sources
