. 2012 Jan;40(2):813-27.
doi: 10.1093/nar/gkr728. Epub 2011 Sep 21.

Polymerization and nucleic acid-binding properties of human L1 ORF1 protein

Affiliations

Polymerization and nucleic acid-binding properties of human L1 ORF1 protein

Kathryn E Callahan et al. Nucleic Acids Res. 2012 Jan.

Abstract

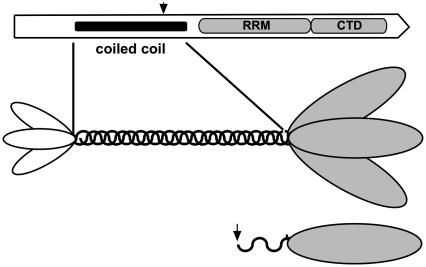
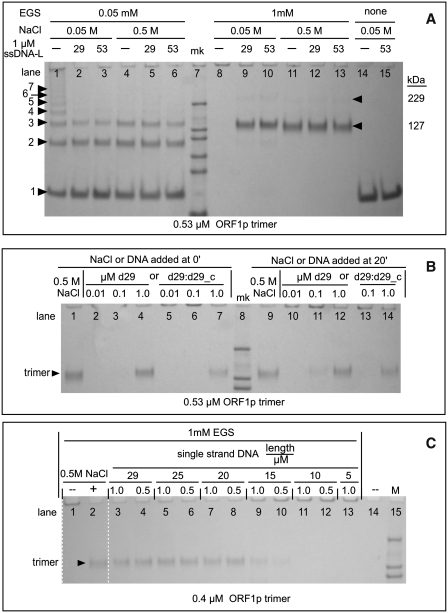
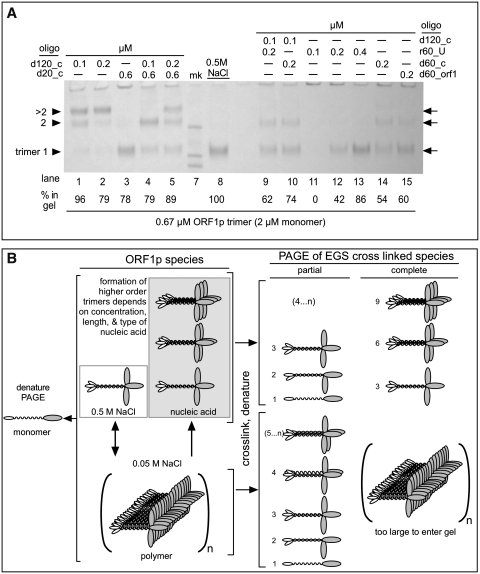
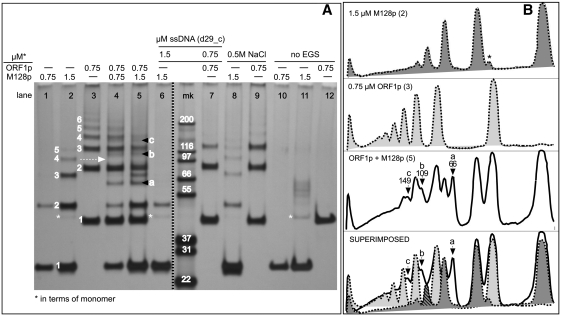
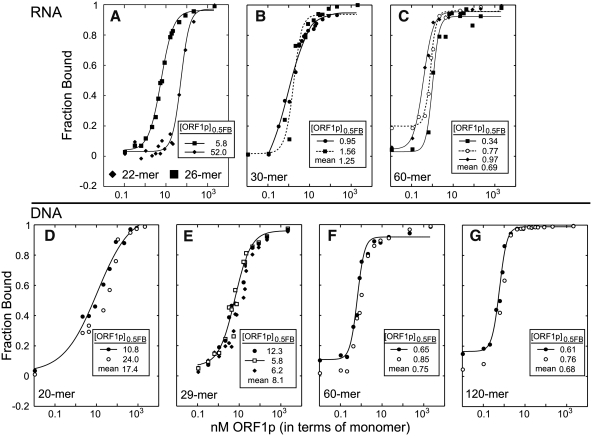
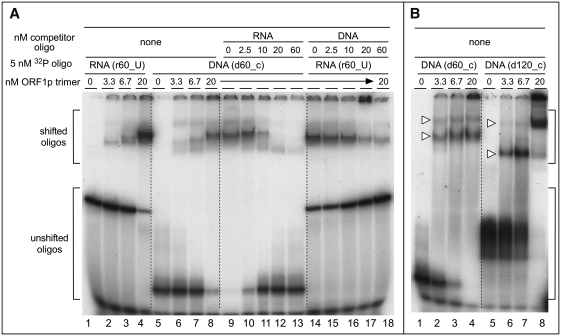
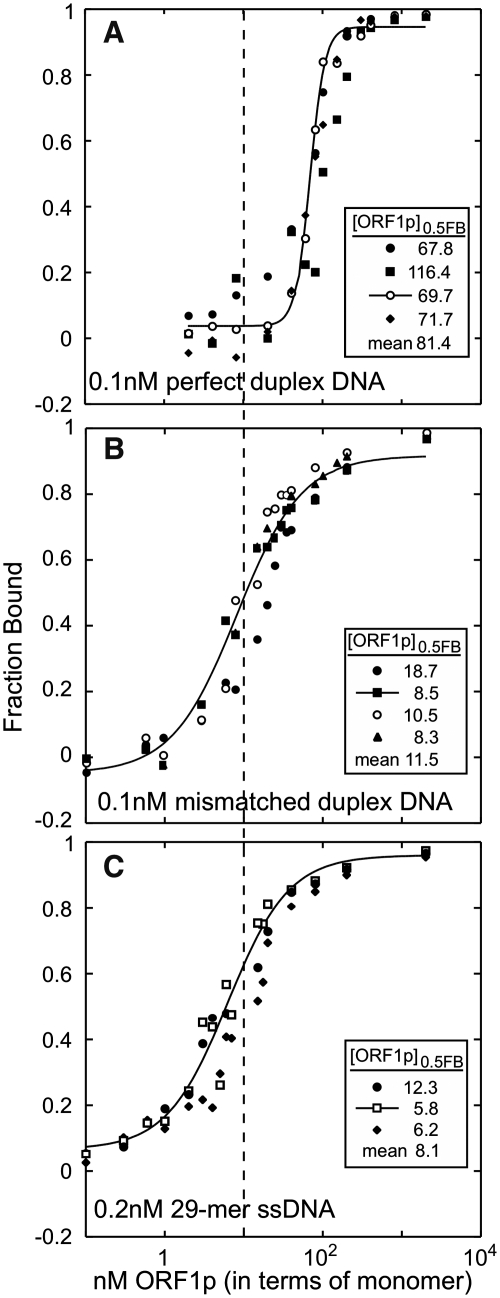
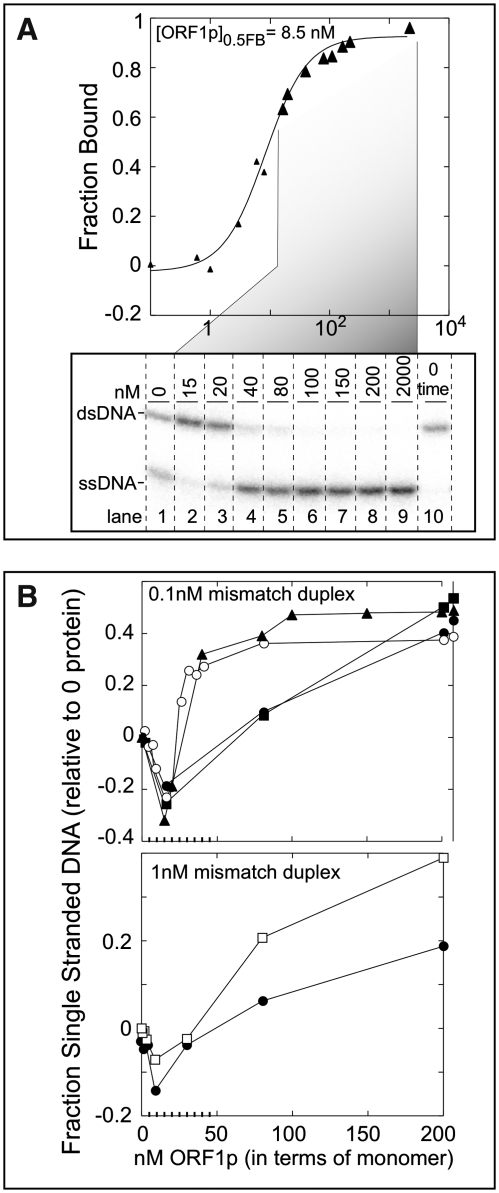
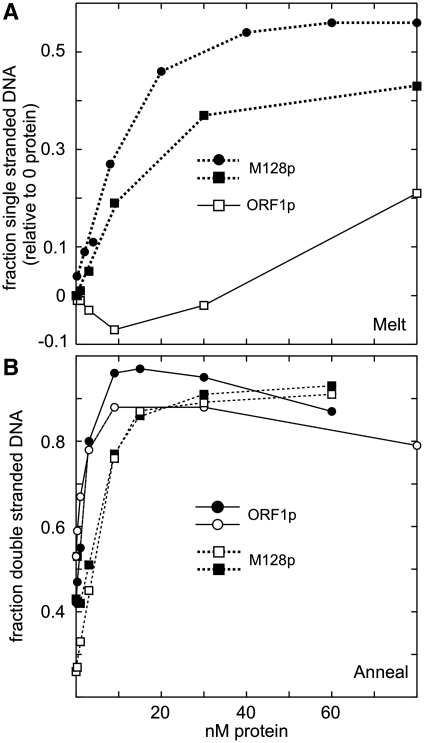
The L1 (LINE 1) retrotransposable element encodes two proteins, ORF1p and ORF2p. ORF2p is the L1 replicase, but the role of ORF1p is unknown. Mouse ORF1p, a coiled-coil-mediated trimer of ∼42-kDa monomers, binds nucleic acids and has nucleic acid chaperone activity. We purified human L1 ORF1p expressed in insect cells and made two findings that significantly advance our knowledge of the protein. First, in the absence of nucleic acids, the protein polymerizes under the very conditions (0.05 M NaCl) that are optimal for high (∼1 nM)-affinity nucleic acid binding. The non-coiled-coil C-terminal half mediates formation of the polymer, an active conformer that is instantly resolved to trimers, or multimers thereof, by nucleic acid. Second, the protein has a biphasic effect on mismatched double-stranded DNA, a proxy chaperone substrate. It protects the duplex from dissociation at 37°C before eventually melting it when largely polymeric. Therefore, polymerization of ORF1p seemingly affects its interaction with nucleic acids. Additionally, polymerization of ORF1p at its translation site could explain the heretofore-inexplicable phenomenon of cis preference-the favored retrotransposition of the actively translated L1 transcript, which is essential for L1 survival.


Figures

Figure 1.
Figure 1.
Schematic representation of ORF1p. The top diagram shows the location of the major domains in the ORF1p of an active L1Pa1 element (the L1.3 member of the Ta-1 subfamily, respective refs 4 and 38). The amino acids corresponding to the predicted coiled-coil domain (41), the RNA recognition motif (RRM, ref. 25), and the C-terminal domain (CTD, ref. 30) are shown in Supplementary Figure S1. The arrow indicates the start of the N-terminal deletion mutant, M128p (see text and Supplementary Data). The middle diagram depicts the trimer modeled on the relative sizes of the N-terminal region, coiled-coil domain, and C-terminal half of the mouse protein as revealed by atomic force microscopy (26). The areas of the ovals corresponding to the N-terminal region and C-terminal half are proportional to their masses. The bottom diagram depicts the M128p protein monomer.
Figure 2.
Figure 2.
ORF1p polymers—effect of oligonucleotides and NaCl. Cross-linking with EGS was carried out as described in the ‘Materials and Methods’ section. (A) Cross-linked ORF1p products generated by 0.05 mM and 1.0 mM EGS at 0.05 and 0.5 M NaCl in the absence and presence of a molar excess of oligonucleotides. The 29-mer single-stranded DNA is d29_c; the 53-mer is d53_pT-b (Table 1). The numbers to the left of the arrowheads at lane 1 indicate the estimated number of monomers in each species. The estimated kDa's for bands 1–7 are respectively: 41, 85, 127, 163, 216, 229 and 298. The kDa of the marker bands (mk) are: 200, 116, 97, 66, 55, and 37. Estimated kDa >200 are extrapolated values and therefore only approximations. The arrowheads to the right of lane 13 indicate the position of the trimer and a putative dimer of the trimer (trimer2). (B) Effect of time of addition of oligonucleotide or 0.5 M NaCl on cross-linked products generated by 1 mM EGS. The reactions with oligonucleotides were in 0.05 M NaCl. The single-stranded DNA is d29; the double-stranded DNA is a duplex of d29 and d29_c (Table 1). The marker bands are 200, 116 and 97 kDa. One millimolar EGS was added immediately after NaCl or oligonucleotides were added to the reactions electrophoresed in lanes 9–14. (C) Effect of oligonucleotide length on ORF1p polymerization. Cross-linking was with 1 mM EGS. The oligonucleotides used in these experiments are all of the dN_c set shown in Table 1 where N is the length (L) of the oligonucleotide. Each oligonucleotide was tested at 1 and 0.5 µM, as indicated in the major header (length/µM) for lanes 3–13 in reactions that contained 0.05 M NaCl. The marker bands are 200, 116 and 97 kDa.
Figure 3.
Figure 3.
ORF1p polymers—effect of oligonucleotide length and concentration. (A) Cross-linking with 1 mM EGS was carried out as described in the ‘Materials and Methods’ section and all of the oligonucleotide-containing reactions were at 0.05 M NaCl. The arrows indicate the position of the trimer, and higher multiples thereof, i.e. trimer2, >timer2, the latter of which we presume is a trimer of the ORF1p trimer. While the mobility of the trimer band corresponds to its expected molecular (127 kDa), the higher trimer multiples correspond to molecular weights of 223 and 294 kDa, respectively, less than expected and likely the result of extrapolation error (see legend to Figure 3A). The marker bands are 200, 116 and 97 kDa. We determined the relative recovery of protein in each lane by densitometry using ImageJ (50) on a tiff file of the gel image captured by a Qimaging® Micropublisher 5.0 RTV camera. The ‘% in gel’ indicates the percent recovery of total protein in the various bands normalized to the amount recovered as trimer cross linked in 0.5 M NaCl, which we set to 100%. As noted in the text, the distribution of total protein among the various bands depends on the length and concentration of the oligonucleotide. (B) Schematic representation of possible ORF1p species and their cross-linked products generated in the experiments shown in Figures 2 and 3A. The numbers to the left of the cartoons of the cross-linked species indicate their monomer content.
Figure 4.
Figure 4.
Polymer formation by the M128p monomer. (A) Effect of oligonucleotide (in 0.05 M NaCl) or of 0.5 M NaCl on cross-linked products generated by reaction with 0.05 mM EGS with M128p (lanes 1 and 2), ORF1p (lane 3), or mixtures thereof (lanes 4 and 5). The protein was visualized using silver stain. The numbers indicate the estimated kDa of the indicated band as integer multiples of the kDa of the respective monomer band (#1) for M128p (between lanes 1 and 2) and ORF1p, (between lanes 2 and 3). For M128p, the respective values for bands 1–5 are: 27, 48, 75, 101 and 123 kDa. For ORF1p, the respective values bands for 1–6 are: 40, 86, 123, 155, 186, and 221 kDa. The dashed arrow indicates the band (#4) in the M128p pattern (lane 2), which is missing in the mixed cross-linking experiment displayed in lane 5 [cross-hatched in the superimposed traces shown at the bottom of (B)]. The letters, a, b and c indicate the novel bands that appear in the mixed cross-linking experiment, bottom two traces of panel B. Band #1 in lane 8 is a doublet (more obvious on the original gel) with an additional faster migrating band which likely represents internal cross-links of the 24-kDa monomer. An extra marker lane was removed from the gel image between lanes 6 and mk indicated by the broken dark line. The minor band at about 40 kDa in lane 11 (asterisks) is undigested Trx-HIS-TEV-M128p (see ‘Materials and Methods’ section). The other bands are unknown contaminants. (B) ImageJ densitometry traces of the indicated lanes. The numbers under letters a, b and c are the estimated kDa of the indicated bands. Note that the signal produced by silver staining, though quite sensitive and reproducible, not only is notoriously non-linear with respect to the amount of protein but also has a limited dynamic range. For example, the relative intensity of the bands in lanes 1 and 2 do not reflect the 2-fold difference in the amount of protein loaded in these lanes. Additionally, the expected increase in monomer intensity in instances where it would be expected because of a decrease in the amounts of the higher molecular weight multimers (e.g. lanes 6 versus 2, lanes 9 versus 3) is not obvious. However, the near-perfect superimposition of the density traces of the major protein species in lanes 2, 3 and 5 (B), indicates that little of these species were consumed by the formation of hybrid M128p / ORF1p products.
Figure 5.
Figure 5.
Binding of single-stranded nucleic acids by ORF1p. Each panel shows the results of independent filter binding assays carried out for 1 h at 37°C as described in the ‘Materials and Methods’ section. The insert on each plot shows the [ORF1p]0.5FB (the concentration of protein at which half of the nucleic acid is bound) for each reaction along with the mean. The sequences of the oligonucleotides are given in Table 1. (A) 22-mer and 26-mer RNAs are, respectively, r22_3′ UTR and r26_3′ UTR. The 30-mer and 60-mer RNAs are respectively (B) r30_3′ UTR-a, and (C) r60_U. The single-stranded DNAs are respectively (D–G) d20_c, d29_c, d60_c and d120_c.
Figure 6.
Figure 6.
Electrophoresis of ORF1p–nucleic acid complexes. We carried out these electromobility shift assays of RNA or DNA by ORF1p as described in the ‘Materials and Methods’ section. The sequences of oligonucleotides are given in Table 1. Brackets indicate the shifted and un-shifted oligonucleotides. (A) ORF1p electromobility shifts in the absence (lanes 1–8) and presence of non-radiolabeled competitor (lanes 9–18). (B) Comparison of ORF1p electromobility shifts with 60-mer (d60_c, lanes 1–4) and 120-mer (d120_c, lanes 5–8) oligonucleotides. The white triangles indicate the slower and faster migrating bands mentioned in the text.
Figure 7.
Figure 7.
Comparison of single-stranded and double-stranded DNA binding by ORF1p. Each panel shows independent filter binding assays carried out at 37°C as described in the ‘Materials and Methods’ section. The insert shows the [ORF1p]0.5FB for each assay along with the mean. (A) The perfect duplex, d29:[32P]-d29_c (Table 1). (B) The mismatched duplex, d29:[32P]-d29_cmm. (C) The single-stranded 29-mer, d29_c, the same data presented in Figure 5E. The vertical dashed line marks the [ORF1p]0.5FB for ORF1p binding to the mismatched duplex (B).
Figure 8.
Figure 8.
Fate of the mismatched duplex. (A) Binding curve of ORF1p with the mismatched duplex, d29:[32P]-d29_cmm, from the experiment shown in Figure 7B (plot with filled triangles), which was also plotted here as filled triangles. Large triangles indicate the samples that were examined by PAGE in the lower part of the panel. The image of the dried gel shows the [32P]-d29_cmm products: double-stranded (ds) and single-stranded (ss) DNA, at the indicated ORF1p concentrations. Lane 10 shows the sample at 0 time in the absence of protein. (B) (Upper plot) The fraction single-stranded DNA was plotted after correcting for the amount of melting that occurred without protein after incubation for 1 h at 37°C. This plot shows the results from the four independent binding experiments shown in Figure 7B using the same symbols in both cases. As shown in lanes 6–9 in the lower part of (A), all of the duplex eventually melted. However, the fraction of single-stranded DNA is <1 due to subtraction of the fraction single-stranded DNA that occurred in the absence of protein. (Lower plot) This panel shows the results from two independent binding assays using 1 nM of the mismatched duplex, d29:[32P]-d29_cmm. These reactions were incubated at 37°C for just 5 instead of 60 min for the other binding assays.
Figure 9.
Figure 9.
DNA melting and annealing by ORF1p and M128p. These experiments were carried out as described in the ‘Materials and Methods’ section. The indicated amounts of protein (in terms of monomer) were incubated with the appropriate substrates for 5 min at 37°C, whereupon the fractions of single-stranded or double-stranded DNA were determined by gel electrophoresis as described for the experiments in Figure 8. (A) The ORF1p data are taken from the lower plot of Figure 8B (open squares in both cases). The mismatched duplex DNA (1 nM) used for M128p was (d29:[32P]-d29_cmm). The differences in the ultimate fraction of single-stranded DNA produced reflect the different values for the fraction of single-stranded DNA generated at 37°C in the absence of protein, which were subtracted from these values (see text). (B) Annealing assays with 2 nM d29 and 1.8 nM [32P]-d29_c (filled circles) or 1.8 nM [32P]-d29 and 2 nM d29_c (the other symbols). All of the results in (A) and (B) were generated in independent reactions.

Similar articles

Cited by

References

    1. Eickbush TH, Malik HS. In: Mobile DNA II. Craig NL, Craigie R, Gellert M, Lambowitz AM, editors. Washington DC: ASM Press; 2002. pp. 1111–1144.
    1. Malik HS, Burke WD, Eickbush TH. The age and evolution of non-LTR retrotransposable elements. Mol. Biol. Evol. 1999;16:793–805. - PubMed
    1. IHGS-Consortium. Initial sequencing and analysis of the human genome. Nature. 2001;409:860–921. - PubMed
    1. Boissinot S, Chevret P, Furano AV. L1 (LINE-1) retrotransposon evolution and amplification in recent human history. Mol. Biol. Evol. 2000;17:915–928. - PubMed
    1. Boissinot S, Entezam A, Young L, Munson PJ, Furano AV. The insertional history of an active family of L1 retrotransposons in humans. Genome Res. 2004;14:1221–1231. - PMC - PubMed

Publication types