. 2012 Mar;11(3):M111.011429.
doi: 10.1074/mcp.M111.011429. Epub 2011 Sep 21.

A quantitative spatial proteomics analysis of proteome turnover in human cells

Affiliations

A quantitative spatial proteomics analysis of proteome turnover in human cells

François-Michel Boisvert et al. Mol Cell Proteomics. 2012 Mar.

Abstract

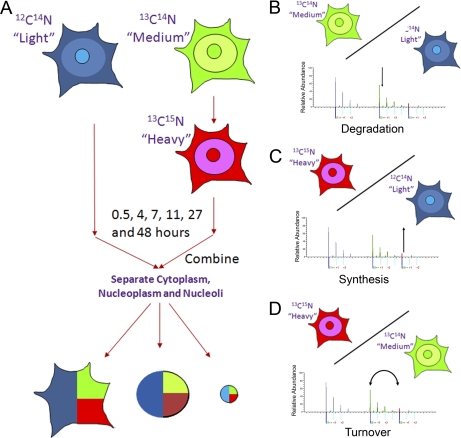
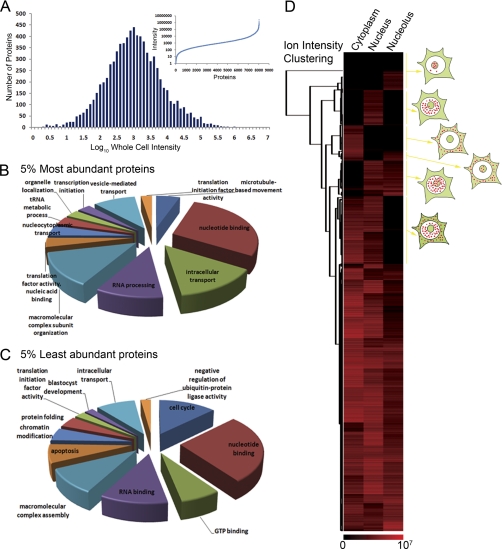
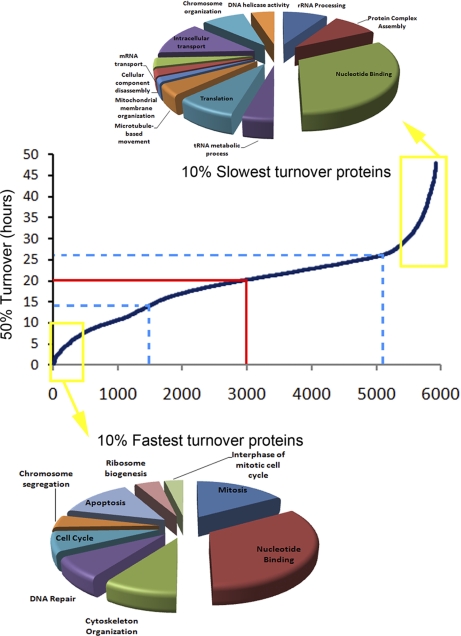
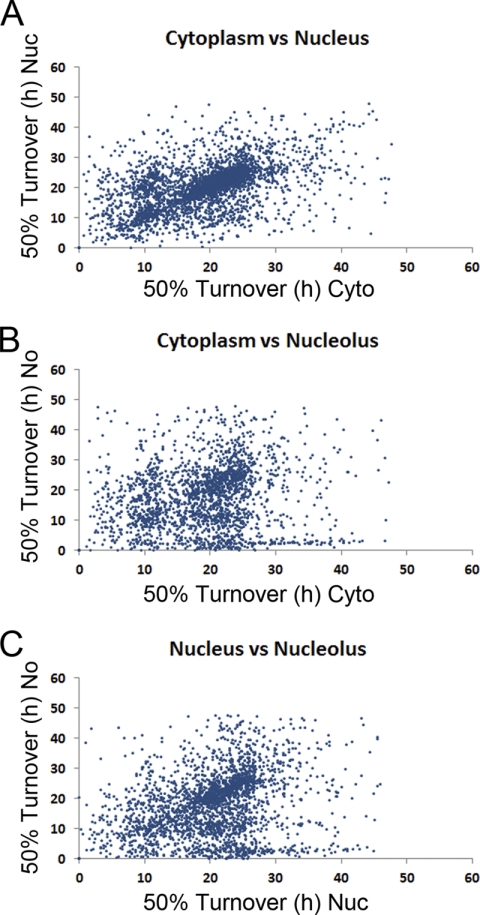
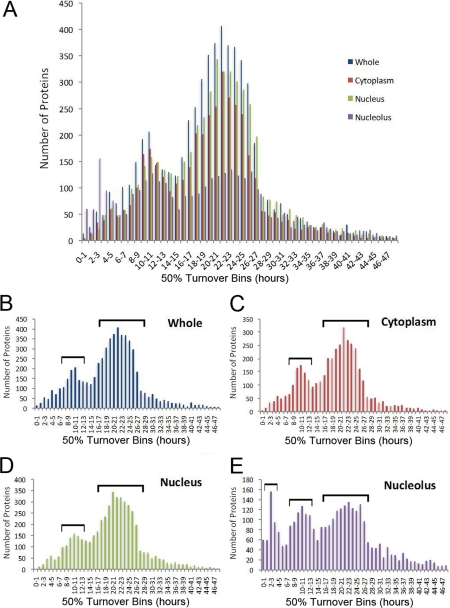
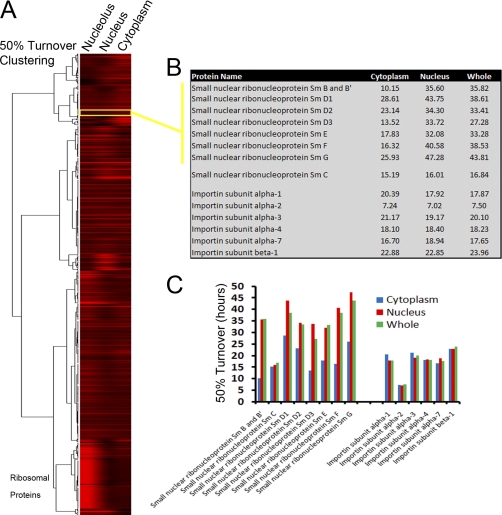
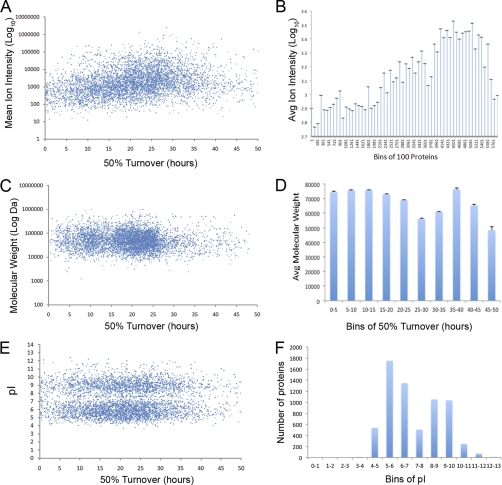
Measuring the properties of endogenous cell proteins, such as expression level, subcellular localization, and turnover rates, on a whole proteome level remains a major challenge in the postgenome era. Quantitative methods for measuring mRNA expression do not reliably predict corresponding protein levels and provide little or no information on other protein properties. Here we describe a combined pulse-labeling, spatial proteomics and data analysis strategy to characterize the expression, localization, synthesis, degradation, and turnover rates of endogenously expressed, untagged human proteins in different subcellular compartments. Using quantitative mass spectrometry and stable isotope labeling with amino acids in cell culture, a total of 80,098 peptides from 8,041 HeLa proteins were quantified, and their spatial distribution between the cytoplasm, nucleus and nucleolus determined and visualized using specialized software tools developed in PepTracker. Using information from ion intensities and rates of change in isotope ratios, protein abundance levels and protein synthesis, degradation and turnover rates were calculated for the whole cell and for the respective cytoplasmic, nuclear, and nucleolar compartments. Expression levels of endogenous HeLa proteins varied by up to seven orders of magnitude. The average turnover rate for HeLa proteins was ~20 h. Turnover rate did not correlate with either molecular weight or net charge, but did correlate with abundance, with highly abundant proteins showing longer than average half-lives. Fast turnover proteins had overall a higher frequency of PEST motifs than slow turnover proteins but no general correlation was observed between amino or carboxyl terminal amino acid identities and turnover rates. A subset of proteins was identified that exist in pools with different turnover rates depending on their subcellular localization. This strongly correlated with subunits of large, multiprotein complexes, suggesting a general mechanism whereby their assembly is controlled in a different subcellular location to their main site of function.


Figures

Fig. 1.
Fig. 1.
Pulse SILAC method. A, HeLa cells are cultured in different SILAC media containing either “light” (L), or “medium” (M) arginines and lysines until full incorporation of the amino acids. The medium of the cells growing with the “medium” amino acids is then changed for a “heavy” (H) medium. Cells are then harvested at different times, along with the equivalent cells growing in the “light” medium. Equal amounts of cells are then combined and separate cytoplasmic, nuclear, and nucleolar fractions were isolated from each time point. The resulting ratios: M/L isotopes over time measures the rate of protein degradation B, increase in the ratio: of H/L measures new protein synthesis C, and the change in the H/M ratio measures the rate of net protein turnover D.
Fig. 2.
Fig. 2.
Protein identification, abundance and subcellular localization. Peptide intensity profiles normalized from the top three peptides based on their mean profile intensity were used to measure protein abundance. A, A distribution plot with the protein count on the y axis and bins of 0.1 of the log10 intensity values on the x axis. The inset shows the distribution from the lowest intensity to the highest intensity protein with the intensity on the y axis and the protein number on the x axis. B, A gene ontology annotation analysis of the 5% most abundant proteins identified using functional clustering of biological processes and molecular functions (GO_BP and GO_MF). C, A gene ontology annotation analysis of the 5% lowest abundant proteins identified using functional clustering of biological processes and molecular functions. D, A hierarchical clustering was performed using the log10 value for intensity for the cytoplasm, the nucleus and the nucleolus and represented as a heat map. In each case high values are shown in red and low ratios in black.
Fig. 3.
Fig. 3.
Distribution of protein turnover. Proteins were sorted on the x axis from fastest to slowest turnover and represented as a scatter plot with the 50% protein turnover value on the y axis. Approximately 60% (blue lines) of the HeLa proteins show a 50% turnover rate within 5 h of the average of ∼20 h (red lines). Functional annotation clustering of gene ontology terms for the 10% proteins with the fastest (bottom) and slowest (top) turnover rates are shown as pie charts, using the number of proteins as weight for each annotation.
Fig. 4.
Fig. 4.
Protein turnover in subcellular compartments. The turnover data for subcellular compartments are plotted against each other to compare the 50% turnover values for each protein in the nucleus versus the cytoplasm (A), the nucleolus versus the cytoplasm (B) and the nucleolus versus the nucleus (C).
Fig. 5.
Fig. 5.
Distribution of protein turnover in subcellular compartments. A distribution plot with the number of proteins on the y axis and 50% turnover values (in bins of 1 h intervals) on the x axis for the whole cell (B), cytoplasmic (C), nuclear (D) or nucleolar (E) proteins, as well as an overlay of all four (A).
Fig. 6.
Fig. 6.
Clustering analysis of protein turnover in subcellular compartments. A, A hierarchical clustering using the 50% turnover values for proteins in the cytoplasm, the nucleus, and the nucleolus is shown represented as a heat map. Fast turnover values are represented in red and slow turnover in black. B, A table showing the 50% turnover of the Sm proteins, i.e. subunits of the small nuclear ribonucleoprotein (snRNP) spliceosome and the Importin transport receptor proteins in the three subcellular compartments. C, Graphical representation of the 50% turnover value of each protein in the cytoplasm (blue), the nucleus (red) or the average for the whole cell (green), with the turnover on the y axis.
Fig. 7.
Fig. 7.
Protein characteristics related to turnover. A, Protein abundance was estimated from the averaged sum of ion intensities measured for every peptide in a protein and plotted on the y axis versus the turnover on the x axis. B, A distribution plot with the average log base 10 intensity on the y axis and bins of 100 proteins on the x axis, where proteins are sorted from the fastest turnover to the slowest turnover for the whole cell. C, The log base 10 of molecular weight (in Daltons) was plotted versus the protein turnover in the whole cell. D, A distribution plot of the average molecular weight in Daltons on the y axis and turnover (shown in 5 h bins) on the x axis. E, A comparison of the protein turnover on the x axis with isoelectric point on the y axis. F, A distribution plot of the number of proteins in each bin of isoelectric points.

References

    1. Ohsumi Y. (2006) Protein turnover. IUBMB Life 58, 363–369 - PubMed
    1. Lundberg E., Fagerberg L., Klevebring D., Matic I., Geiger T., Cox J., Algenäs C., Lundeberg J., Mann M., Uhlen M. (2010) Defining the transcriptome and proteome in three functionally different human cell lines. Mol. Syst. Biol. 6, 450. - PMC - PubMed
    1. Gygi S. P., Rochon Y., Franza B. R., Aebersold R. (1999) Correlation between protein and mRNA abundance in yeast. Mol. Cell Biol. 19, 1720–1730 - PMC - PubMed
    1. Walther T. C., Mann M. (2010) Mass spectrometry-based proteomics in cell biology. J. Cell Biol. 190, 491–500 - PMC - PubMed
    1. Clague M. J., Urbé S. (2010) Ubiquitin: same molecule, different degradation pathways. Cell 143, 682–685 - PubMed

Publication types