. 2011 Nov;36(5):471-7.
doi: 10.1097/SHK.0b013e31822d60ff.

Impaired hepatocellular regeneration in murine sepsis is dependent on regulatory protein levels

Affiliations

Impaired hepatocellular regeneration in murine sepsis is dependent on regulatory protein levels

Arnoley Abcejo et al. Shock. 2011 Nov.

Abstract

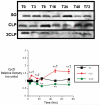
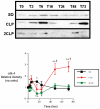
Sepsis is a poorly understood syndrome. Therefore, we examined the mechanisms underlying failed regeneration in sham-operated (SO), mildly septic (cecal ligation and single puncture [CLP]), and severely septic (cecal ligation with two punctures [2CLP]) C57Bl6 mice. Relative to no operation (T0) or SO, CLP, but not 2CLP, increased the number of cells staining for proliferating cell nuclear antigen, a marker for cell division. Levels of the retinoblastoma protein (pRb) were detected at T0 and after SO. CLP increased pRb abundance, whereas 2CLP decreased it. Changes in phosphorylated pRb were similar but more profound. The abundance of the transcription factor E2F was unaltered by SO, CLP, or 2CLP. However, E2F DNA binding activity, although unchanged after SO, increased after CLP and decreased after 2CLP. The abundance of cyclin D1 in nuclear fractions increased following CLP but decreased after 2CLP. Neither SO nor 2CLP altered the abundance of the cyclin-dependent kinase (cdk) 4. However, cdk-4 abundance increased after CLP. Finally, CLP increased the steady-state abundance of the mRNAs encoding thymidine kinase, DNA polymerase α, and dihydrofolate reductase, all required for DNA replication. No changes were noted after 2CLP. We conclude that 2CLP impaired hepatocyte proliferation following 2CLP in part via impaired cyclin D1/cdk-4-induced phosphorylation of pRb, maintaining the association between pRb and E2F and inhibited E2F transcriptional activity.


Figures

Fig 1
Fig 1. Proliferative Cell Nuclear Antigen (PCNA) staining of fixed hepatic sections
a. Section from unoperated (T0) control. b. Sections from SO – Sham Operation, CLP – CLP with a single puncture, 2CLP – CLP with two punctures mice. Primary antibody - mouse monoclonal anti-PCNA, secondary antibody - biotinylated goat anti-mouse IgG. 20 X magnification. Arrows – representative PCNA staining (dark nuclei). Note virtual absence of staining in 2CLP T48 and T72 sections. c. Graphic depiction of numbers of PCNA – positive cells/20X field. X-axis – time after intervention in hours. Y-axis – counts/field. Counts from ten 20x fields/section, five sections/animal, three animals/time point – intervention. Mean ± SD. * = statistically different from T0, ^ = statistically different from SO at same time point, †= statistically different from 2CLP at same time point, # = statistically different than 2CLP at same time point
Fig 2
Fig 2. Immunoblot Analysis of Retinoblastoma Protein (pRb) and Phospho-Retinoblastoma Protein (Phospho-pRb) abundance in the Nucleus
a. pRb. b. Phospho-pRb. Left: representative immunoblots. SO – Sham Operation, CLP –single puncture CLP, 2CLP – double puncture CLP. Number after T indicates time after intervention. 50 μg nuclear protein/lane. Right: Graphic representation of relative abundance. X-axis – time after intervention in hours. Y-axis – relative density (no units). Black squares – SO, Red diamonds – CLP, Green circles – 2CLP. Data (Mean ± SD) derived from densitometric signal intensity on autoradiogram. Data normalized to signal at T0. Each data point represents the mean and SD of 3 measurements. * = statistically different from T0, ^ = statistically different from SO at same time point, † = statistically different from 2CLP at same time point
Fig 3
Fig 3. Electrophoretic Mobility Shift Analysis (EMSA) of Transcription Factor E2F DNA Binding Activity
EMSA representative of studies from three animals/time point - intervention. SO – Sham Operation, CLP – single puncture CLP, 2CLP – double puncture CLP. Number after T indicates time after intervention.
Fig 4
Fig 4. Immunoblot Analysis of cyclinD1 abundance
Top: representative immunoblots. SO – Sham Operation, CLP – single puncture CLP, 2CLP – double puncture CLP. Number after T indicates time after intervention. Bottom: Graphic representation of relative abundance. 50 μg nuclear protein/lane. X-axis – time after intervention in hours. Y-axis – relative density (no units).Data (Mean ± SD) derived from densitometric signal intensity on autoradiogram. Data normalized to signal at T0. Each data point represents the mean and SD of 3 measurements. Black squares – SO, Red diamonds – CLP, Green circle – 2CLP. * = statistically different from T0, ^ = statistically different from SO at same time point, † = statistically different from 2CLP at same time point.
Fig 5
Fig 5. Immunoblot Analysis of cyclin-dependent kinase (cdk) - 4 abundance
Top: representative immunoblots. SO – Sham Operation, CLP – CLP with a single puncture, 2CLP – CLP with two punctures mice. Number after T indicates time after intervention. Bottom: Graphic representation of relative abundance. 50 μg nuclear protein/lane. X-axis – time after intervention in hours. Y-axis – relative density (no units).Data (Mean ± SD) derived from densitometric signal intensity on autoradiogram. Data normalized to signal at T0. Each data point represents the mean and SD of 3 measurements. Black squares – SO, Red diamonds – CLP, Green circles – 2CLP. * = statistically different than T0, ^ = statistically different than SO at same time point, † = statistically different than CLP at same time point.
Fig. 6
Fig. 6. Northern Blot Analysis of Abundance of mRNAs encoding Thymidine Kinase (TK), Di-Hydrofolate Reductase (DHFR) and DNA Polymerase B (DNA Pol)
a. Representative Northern Blots. 20μg mRNA/lane. 18S – 18S Ribosomal Subunit. b. Graphic representation of relative abundance of TK. c. Graphic representation of relative abundance of DHFR. d. Graphic representation of relative abundance of DNAPol. X-axis – time after intervention in hours. Y-axis – relative density (no units). Data (Mean ± SD) derived from densitometric signal intensity on autoradiogram. Data for each signal normalized to 18S signal on same autoradiogram at same time point and then to signal at T0. Each data point represents the mean and SD of 3 measurements. Black squares – CLP, Green circles – 2CLP. * = statistically different than T0, ^ = statistically different from 2

References

    1. Angus DC, Linde-Zwerbel WT, Lidicker J, Clermont G, Carcillo J, Pinsky MR. Epidemiology of severe sepsis in the United States: Analysis of incidence, outcome and associated costs of care. Crit Care Med. 2001;29:1303–1310. - PubMed
    1. Kohl BA, Deutschman CS. The inflammatory response in organ injury. In: Newman MF, Fleisher LA, Fink MP, editors. Perioperative Management. Saunders/Elsevier; Philadelphia: 2008. pp. 19–28.
    1. Rubulotta F, Marshall JC, Ramsay G, Nelson D, Levy M, Williams M. Predisposition, insult/infection, response, and organ dysfunction: A new model for staging severe sepsis. Crit Care Med. 2009;37:1329–1335. - PubMed
    1. Andrejko KM, Deutschman CS. Altered hepatic gene expression in fecal peritonitis: changes in transcription of gluconeogenic, beta-oxidative, and ureagenic genes. Shock. 1997;7:164–169. - PubMed
    1. Deutschman CS, Cereda M, Ochroch EA, Raj NR. Sepsis-induced cholestasis, steatosis, hepatocellular injury, and impaired hepatocellular regeneration are enhanced in interleukin-6 −/− mice. Crit Care Med. 2006;34:2613–2620. - PubMed

Publication types