

Review
doi: 10.1021/cr200295k.
Epub 2011 Sep 23.
Bioinformatics and systems biology of the lipidome
Affiliations
- PMID: 21939287
- PMCID: PMC3383319
- DOI: 10.1021/cr200295k
Item in Clipboard
Review
Bioinformatics and systems biology of the lipidome
Chem Rev.
.
No abstract available
Figures
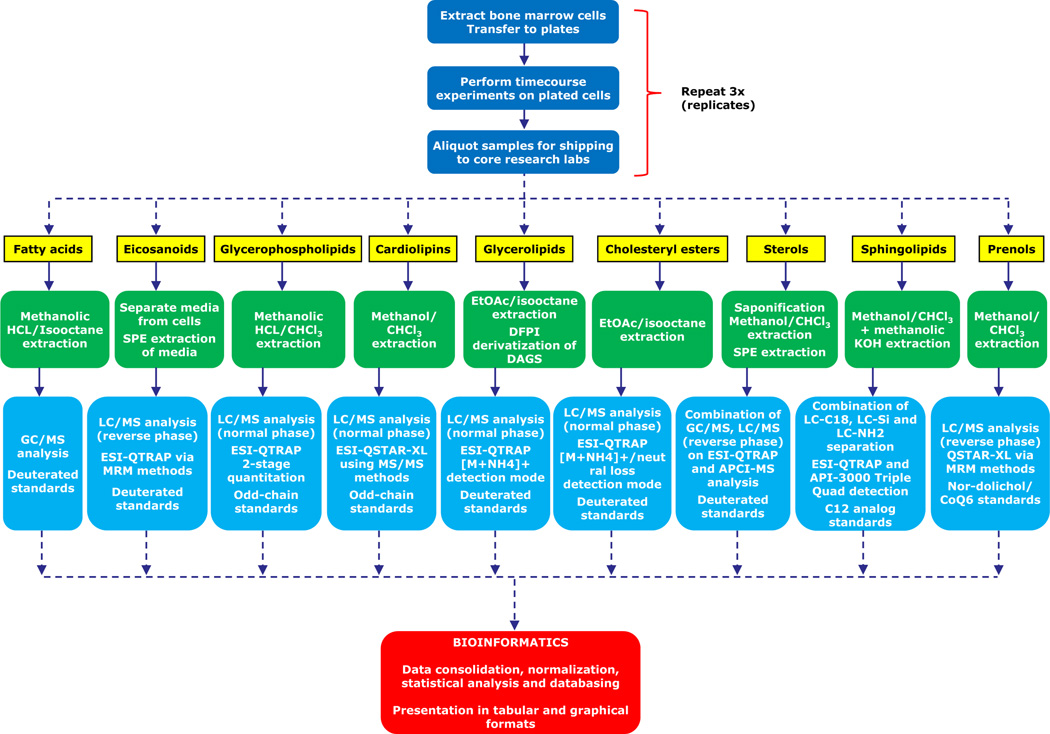
Overview of the process of performing a quantitative lipid analysis of macrophage cell sample (in this example, a time-course experiment using bone marrow derived macrophages). Extraction methods, LC/GC purification methods, MS acquisition strategies and quantitative standard approaches are optimized for each lipid class.,,
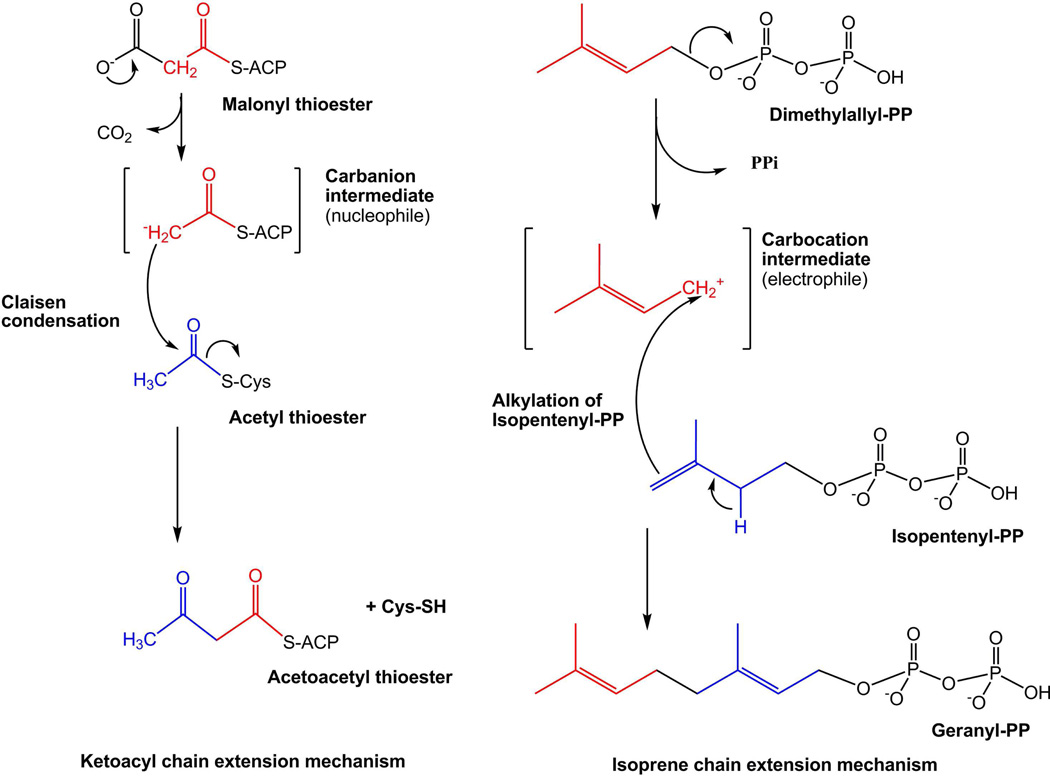
Mechanisms of lipid biosynthesis. Biosynthesis of ketoacyl- and isoprene-containing lipids proceeds by carbanion and carbocation-mediated chain extension, respectively.
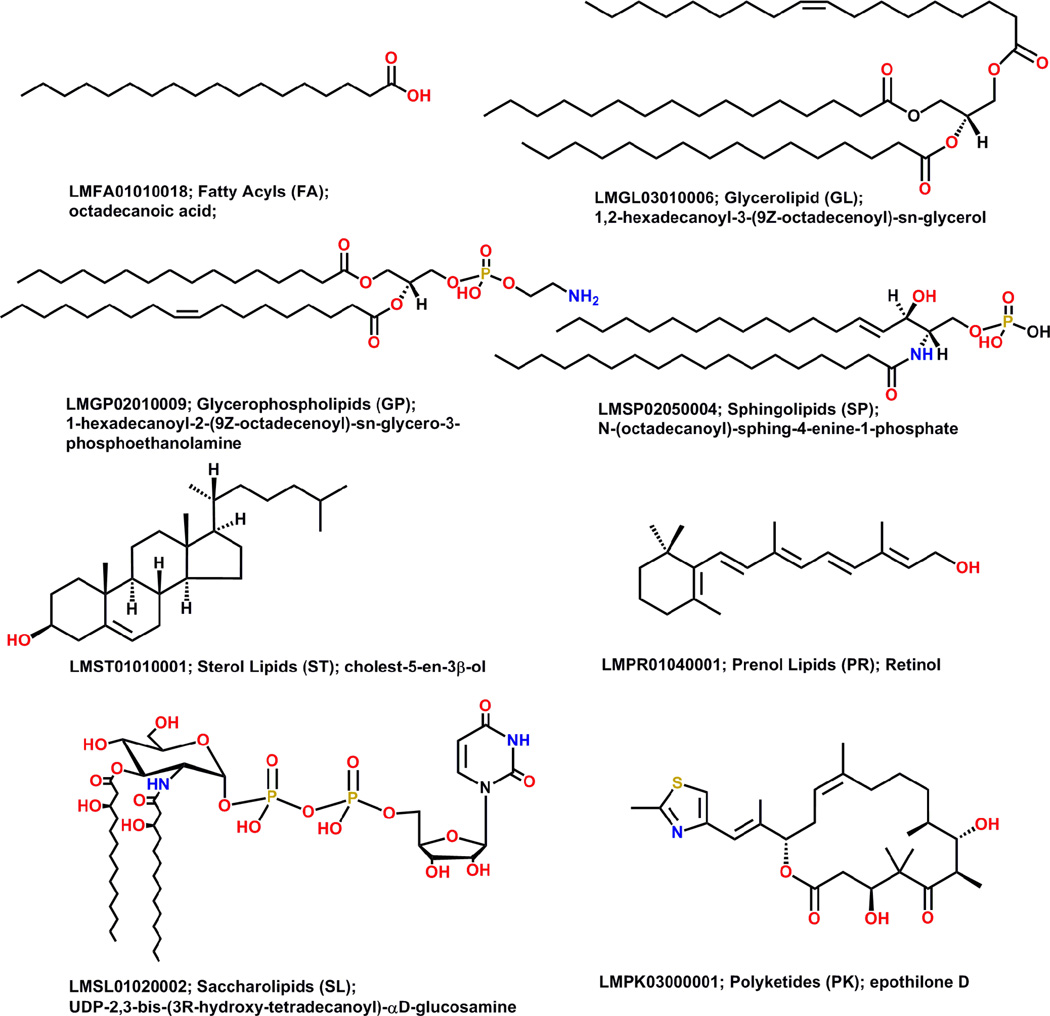
Representative structures from each lipid category shown with LM ID, category name, category abbreviation, and systematic name (Reprinted with permission from Reference . Copyright 2007 Oxford University Press).
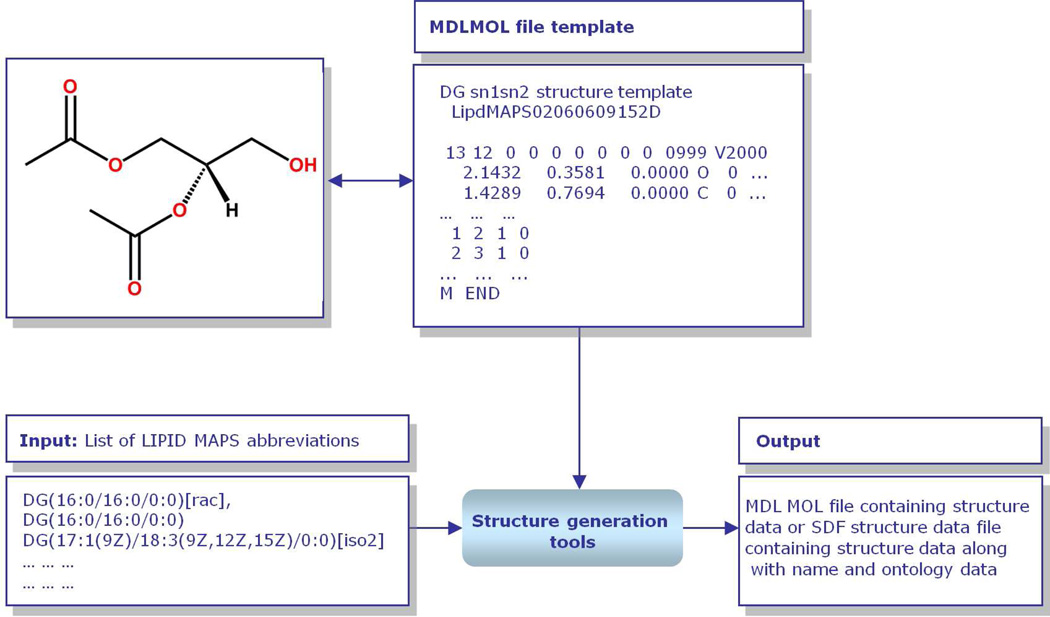
Overview of LIPID MAPS structure data generation methodology. Starting from specified abbreviations for lipids corresponding to LIPID MAPS format, the structure generation tools select an appropriate lipid structure template internally stored in MDL MOL file format, attach appropriate radyl chains, enumerate appropriate lipid structures and generate a MDL MOL structure file or SDF file containing structural data along with name and other ontology data (Reprinted with permission from Reference . Copyright 2007 Oxford University Press).
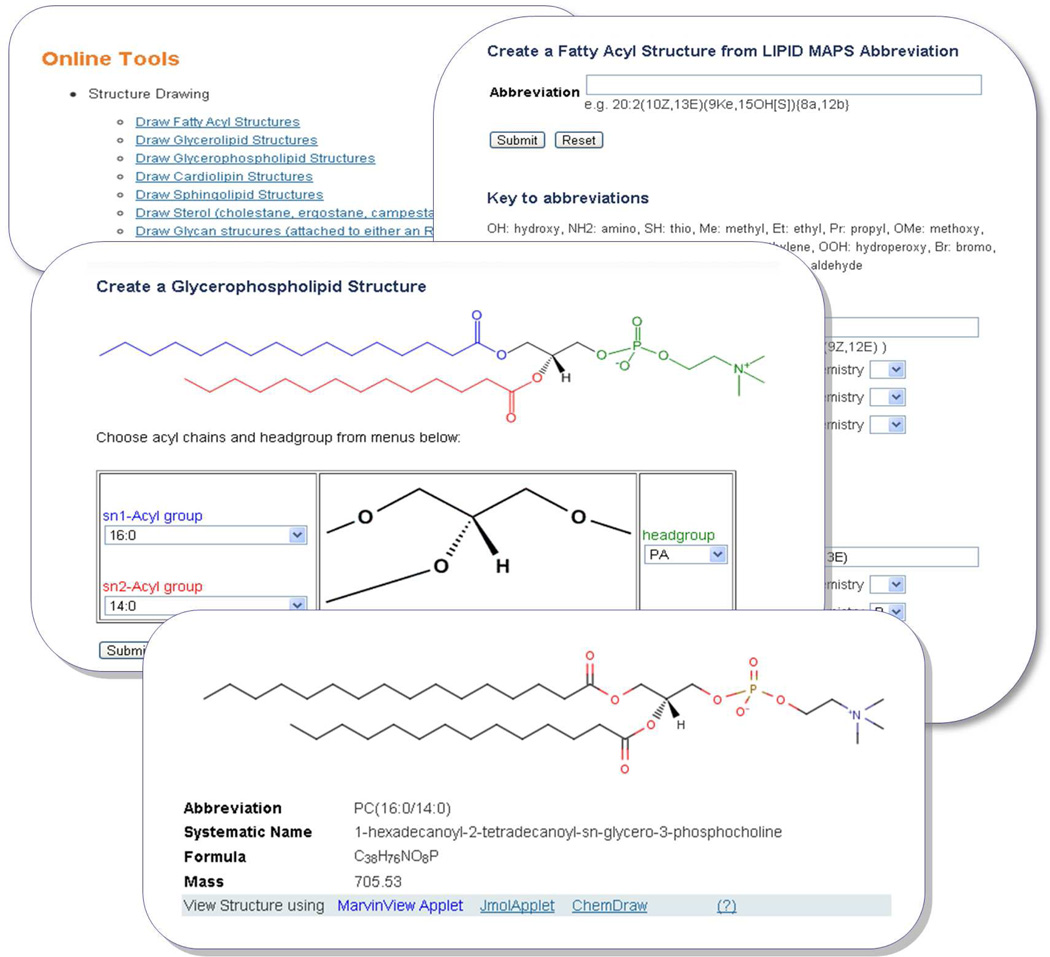
A montage of screen shots showing LIPID MAPS structure drawing tools. The top left box shows structure drawing tools available on the LIPID MAPS website. The top right box shows options available for generating a fatty acyl structure starting from either a complete abbreviation or individual specification of chain and substituent from a with its position and stereochemistry. The middle box shows an example of structure generation using acyl chains and head groups for glycerophospholipids. A comprehensive list of commonly occurring acyl chains and head groups is provided as a pull down list. The button box shows an example of a structure generated for a glycerophospholipid along with other ontological information.
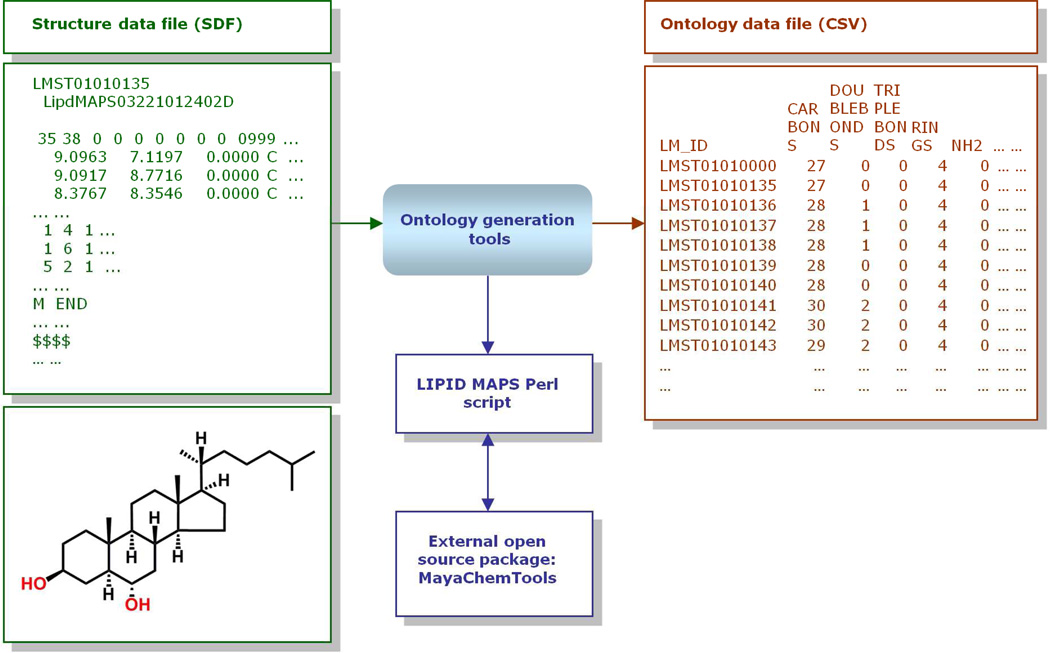
Overview of LIPID MAPS ontology data generation methodology from structure data.
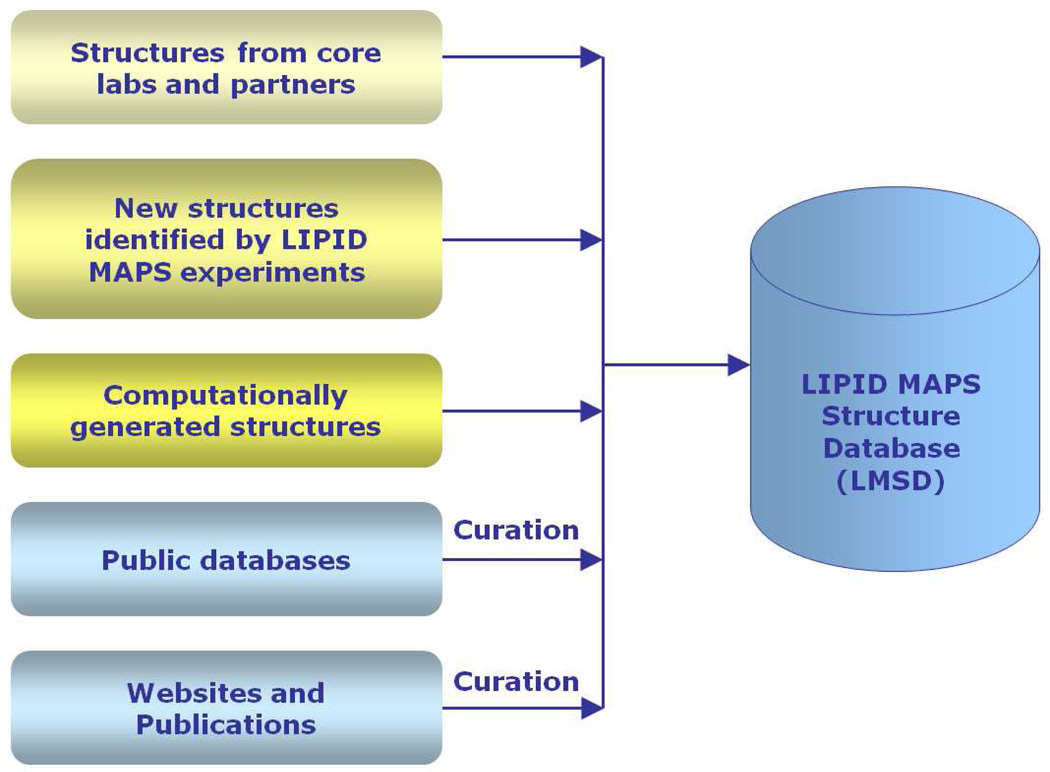
Overview of LIPID MAPS Structure Database (LMSD) generation methodology.
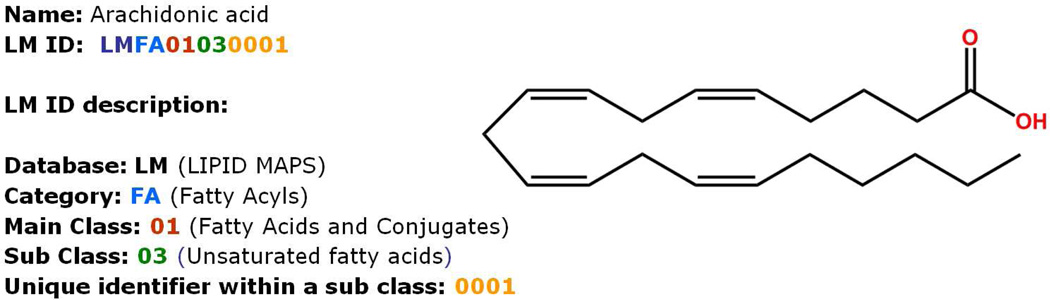
Description of the LIPID MAPS LM ID.
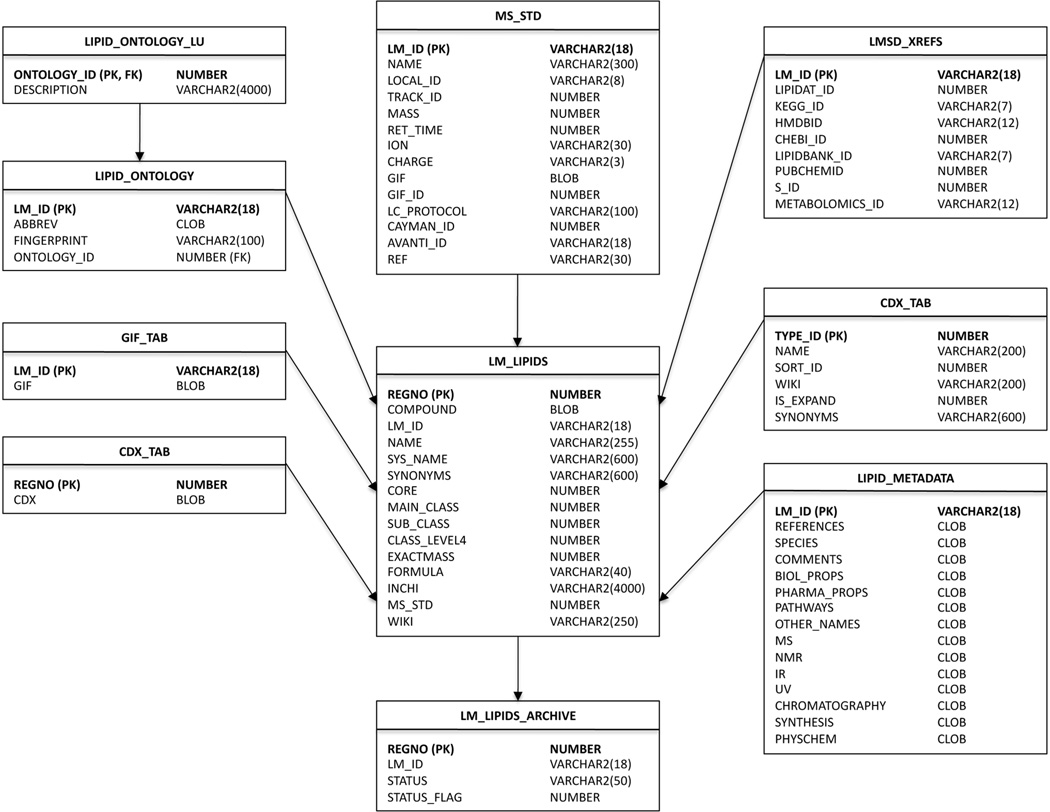
Entity relationship diagram for LMSD showing the Oracle database tables containing structural and classification information as well as annotations and ontological data. The unique LM_ID identifier plays a central role as a primary key in this relational schema.
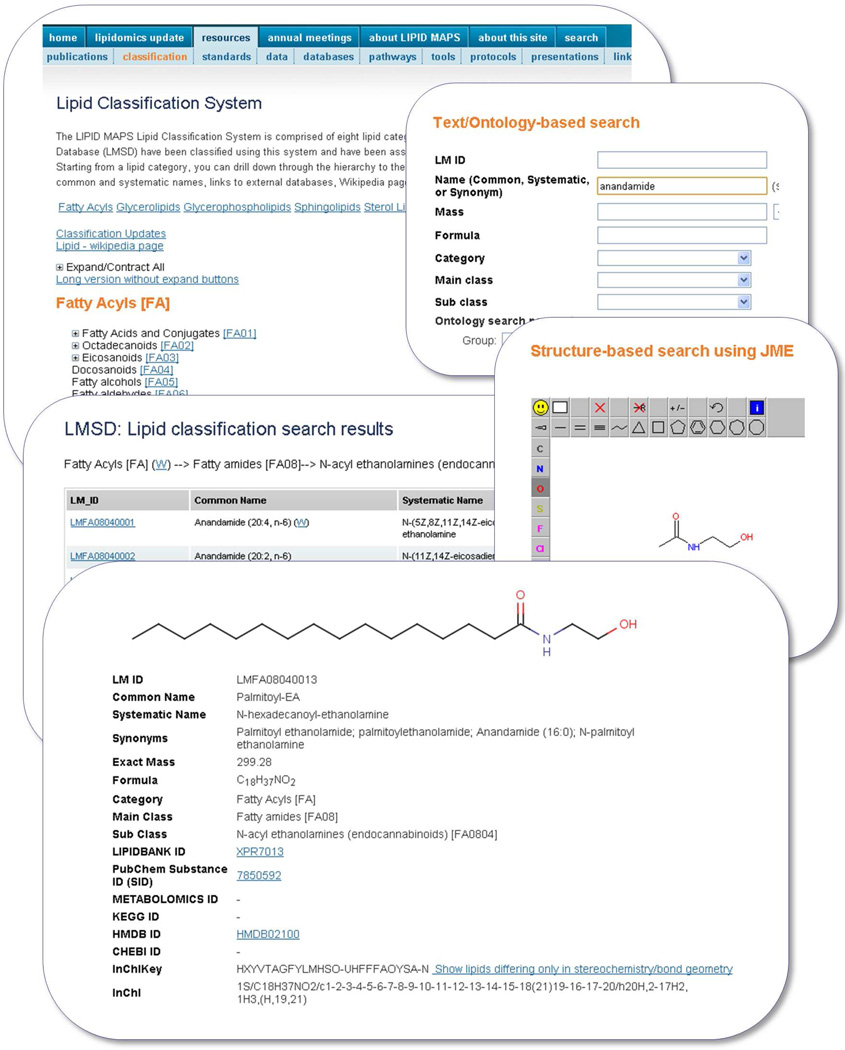
A selection of screen shots showing various options for searching the LIPID MAPS Structure Database (LMSD) and result summary for a specific LM ID.
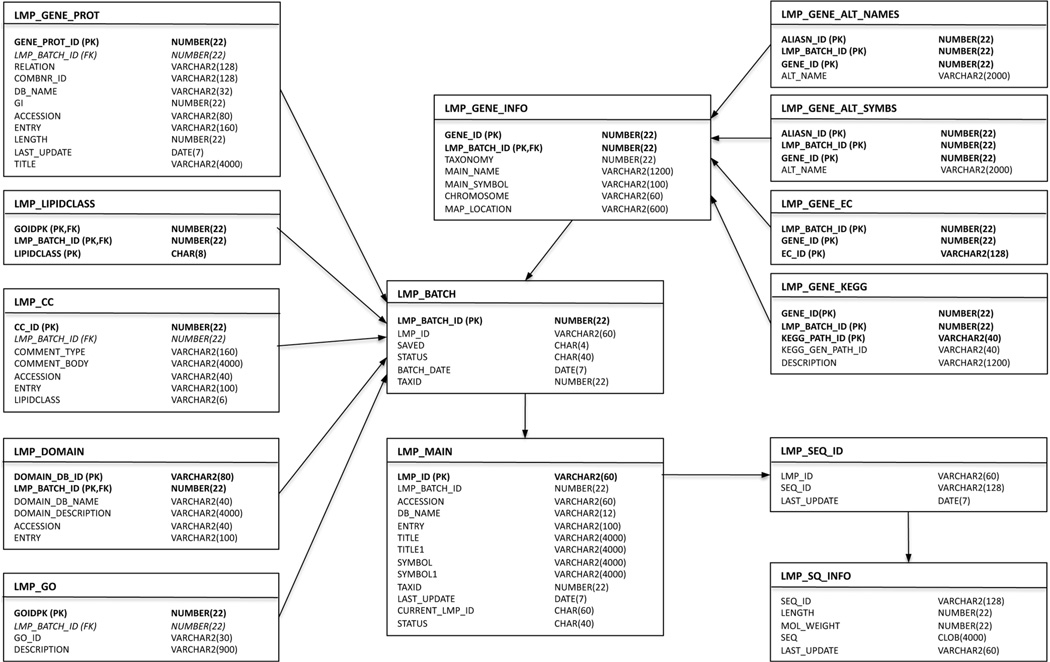
Entity relationship diagram for LMPD showing the Oracle database tables containing information pertaining to lipid-related genes and proteins for human and mouse species.
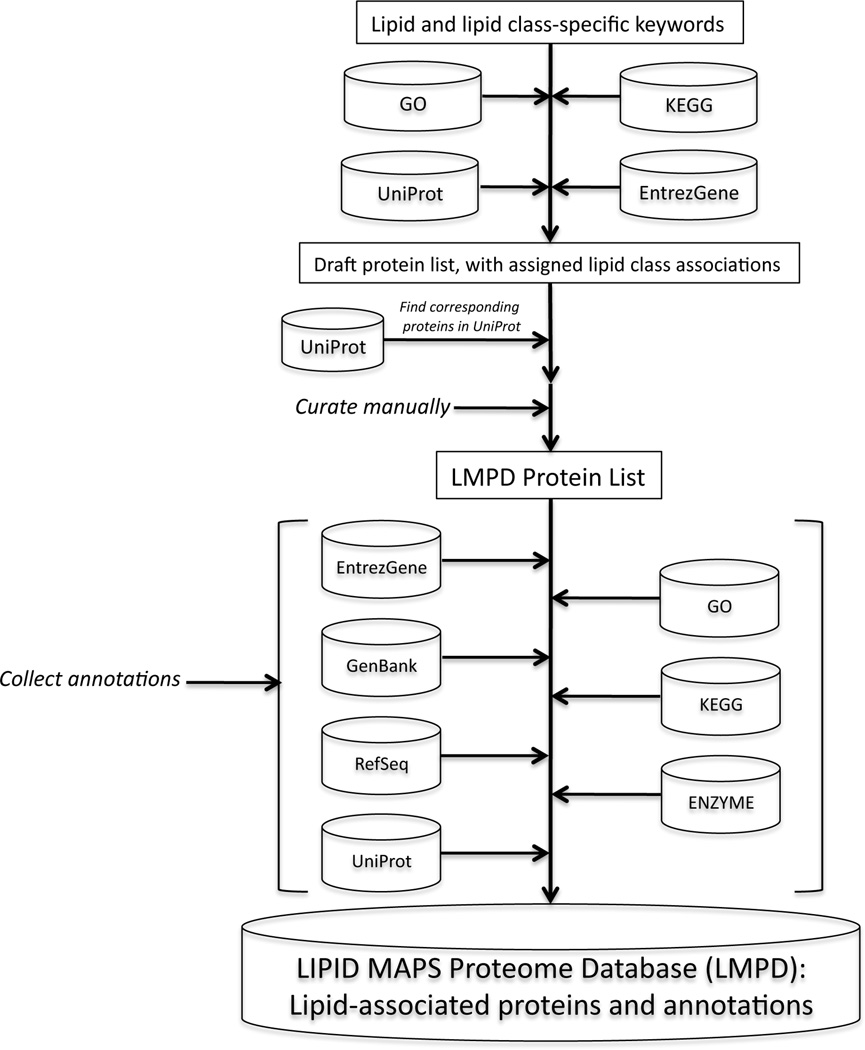
Overview of the bioinformatics process for creating the LIPID MAPS Proteome Database (LMPD).
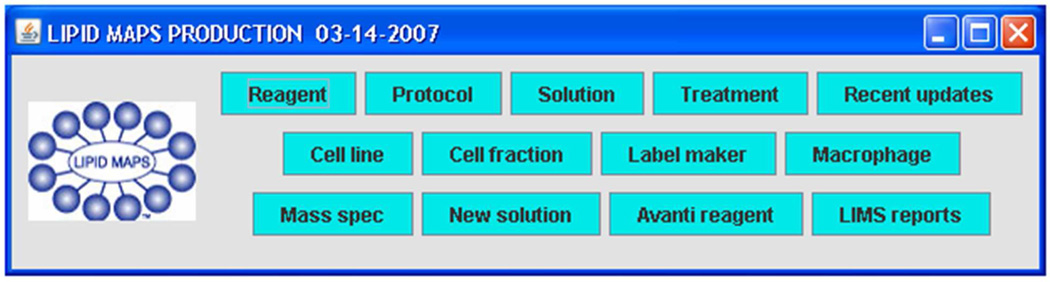
Main user interface of LIPID MAPS LIMS (Reprinted with permission from Reference . Copyright 2007 Elsevier Limited).
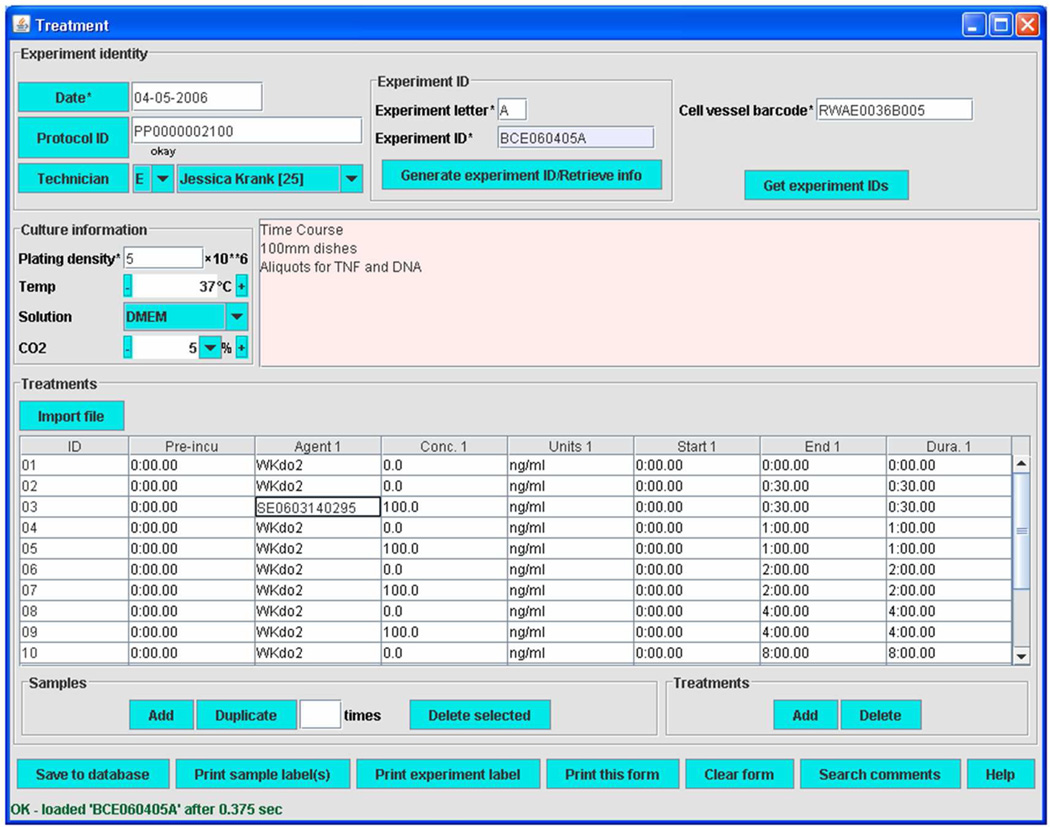
Treatment module of LIMS (Reprinted with permission from Reference . Copyright 2007 Elsevier Limited).
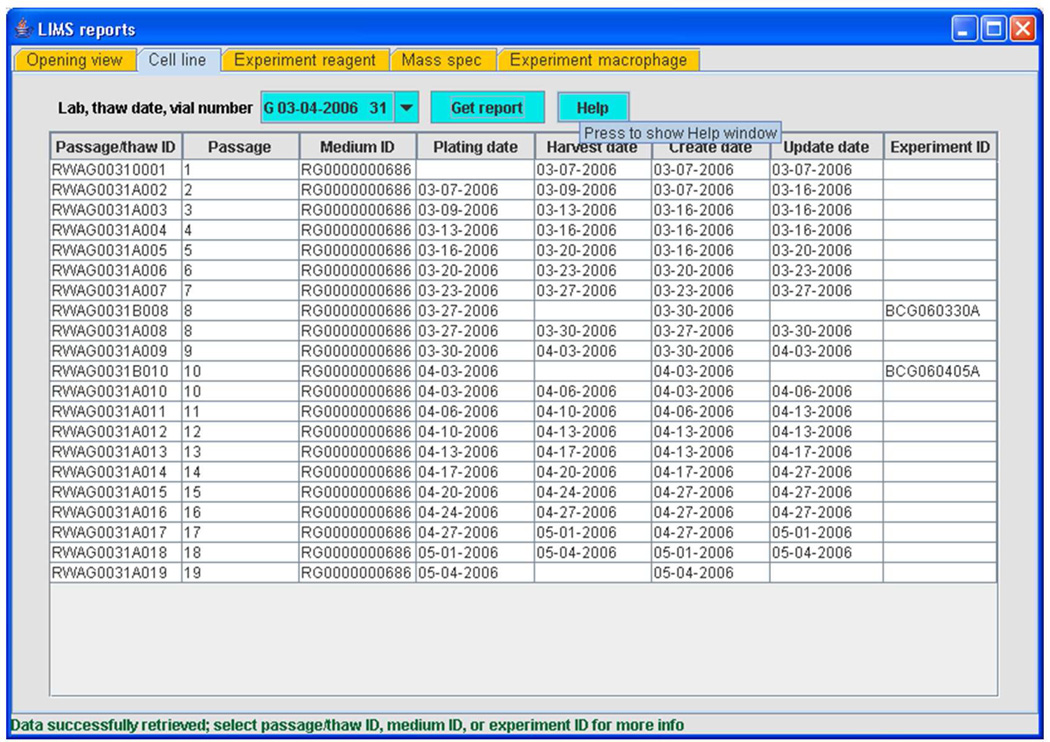
LIMS reporter (reporting tool) module (Reprinted with permission from Reference . Copyright 2007 Elsevier Limited).
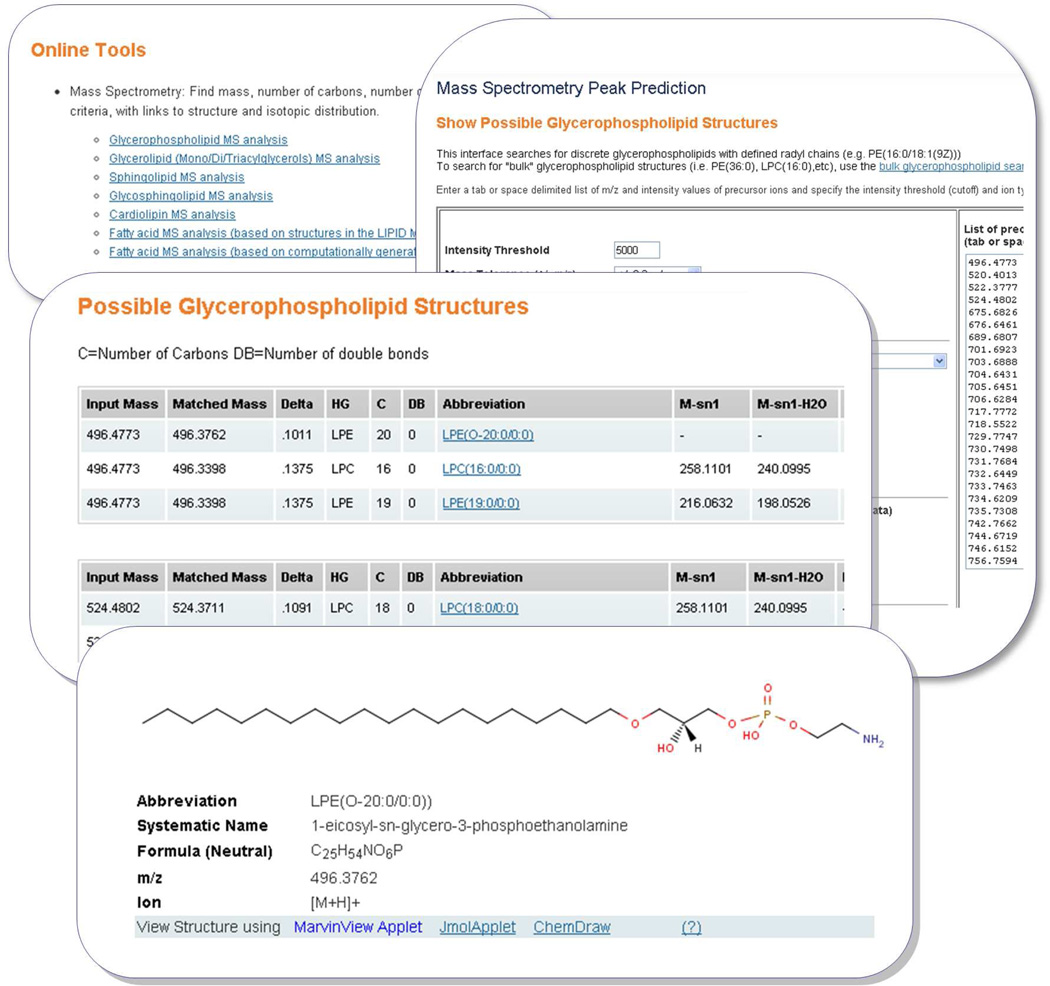
A montage of screen shots showing LIPID MAPS mass spectroscopy tools.
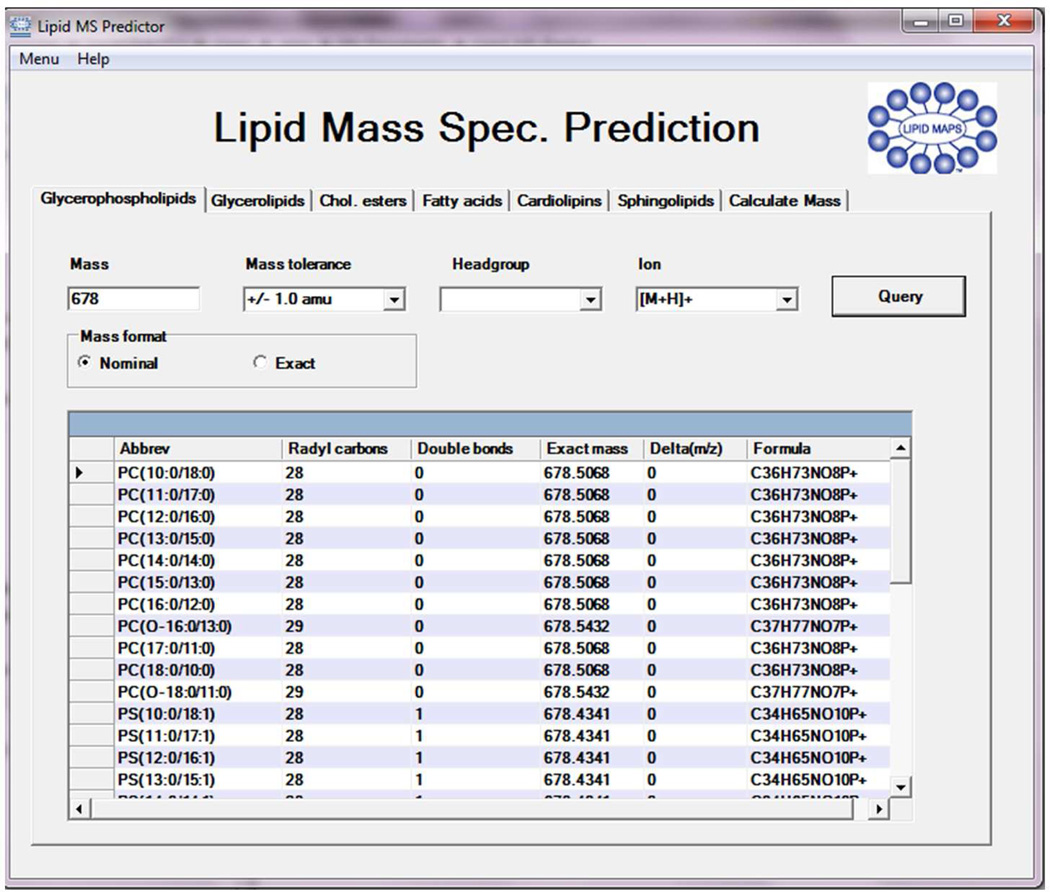
A standalone Windows application, LIPID MAPS MS Prediction Tools, for predicting possible molecular species for a given MS ion. The application enables a user to enter the m/z value of an unknown lipid ion and predict the most likely molecular species. It is available for download at: www.lipidmaps.org/tools/index.html .
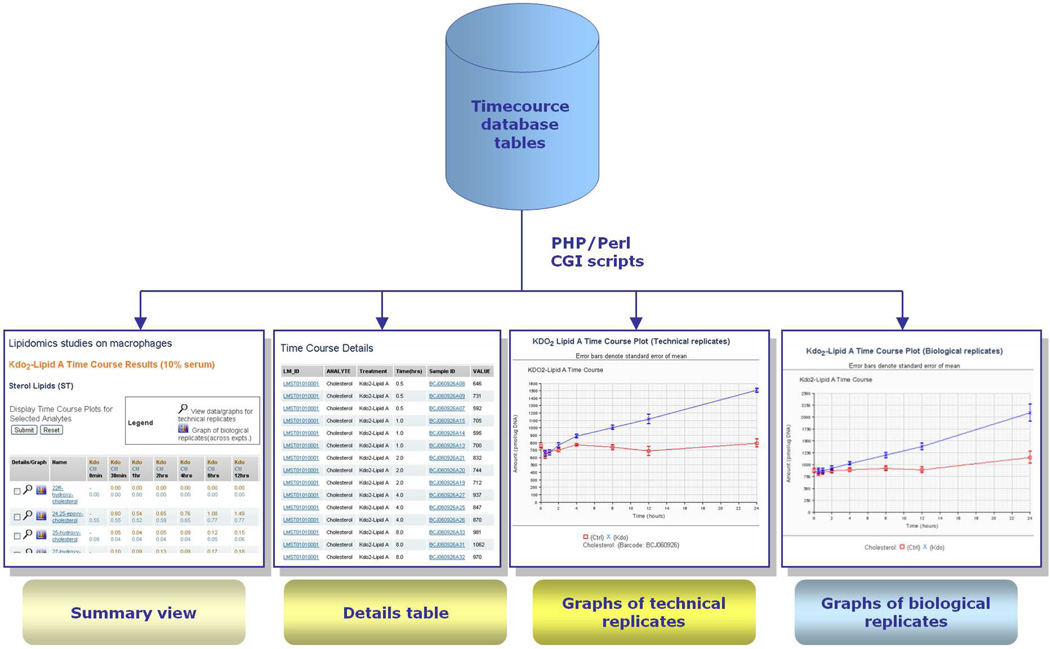
Schema for online data display of timecourse results.
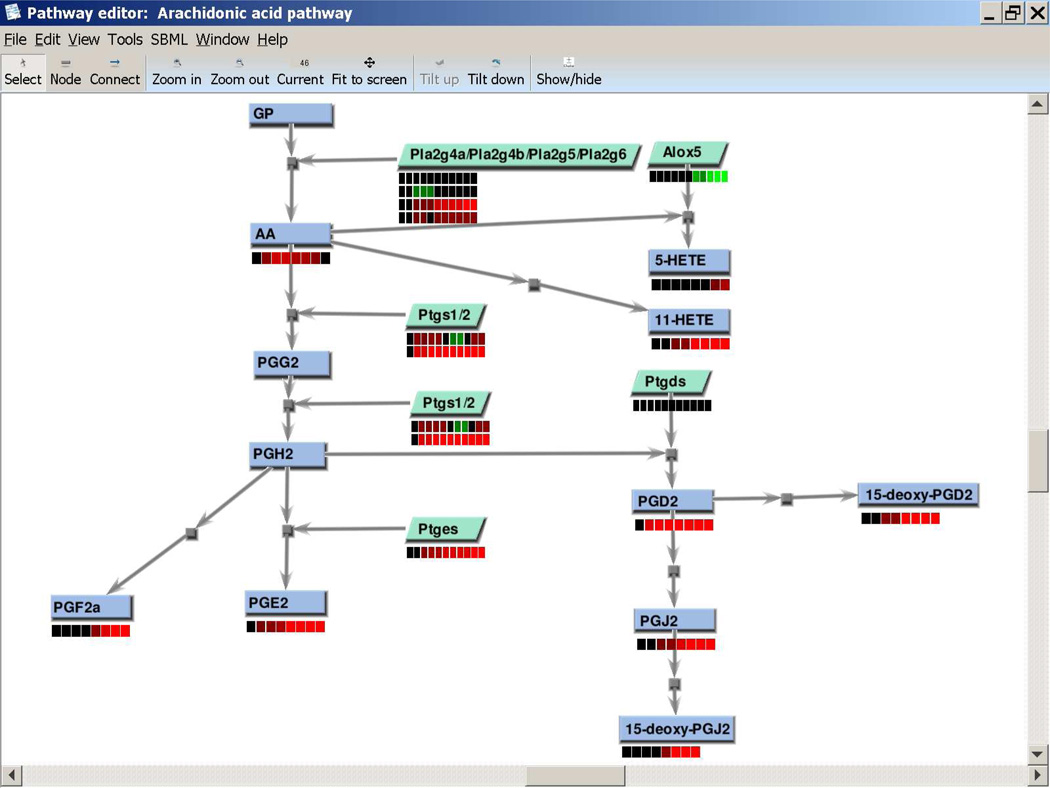
The Pathway Editor showing the mouse arachidonate pathway and timecourse data mapped in heatmap format displayed under the lipid and enzyme (gene) nodes. Samples of RAW264.7 cells (a tissue cell line derived from mouse macrophages) were treated with KLA for times ranging from 0 to 24 hr. Shown are ratios in pmol/ug DNA for metabolites and ratios of normalized intensity for RNA spots with respect to untreated control cells.,
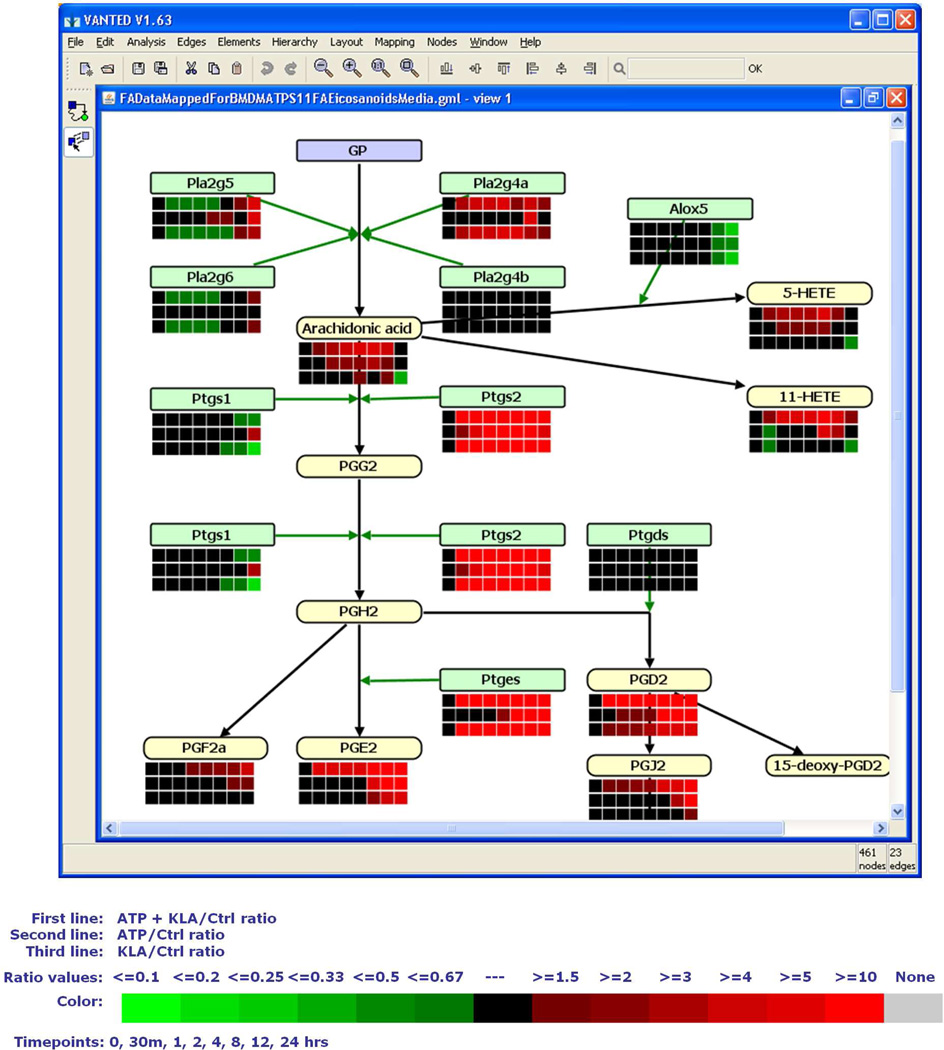
VANTED application showing the mouse arachidonate pathway and timecourse data mapped in heatmap format displayed under the lipid and enzyme (gene) nodes.
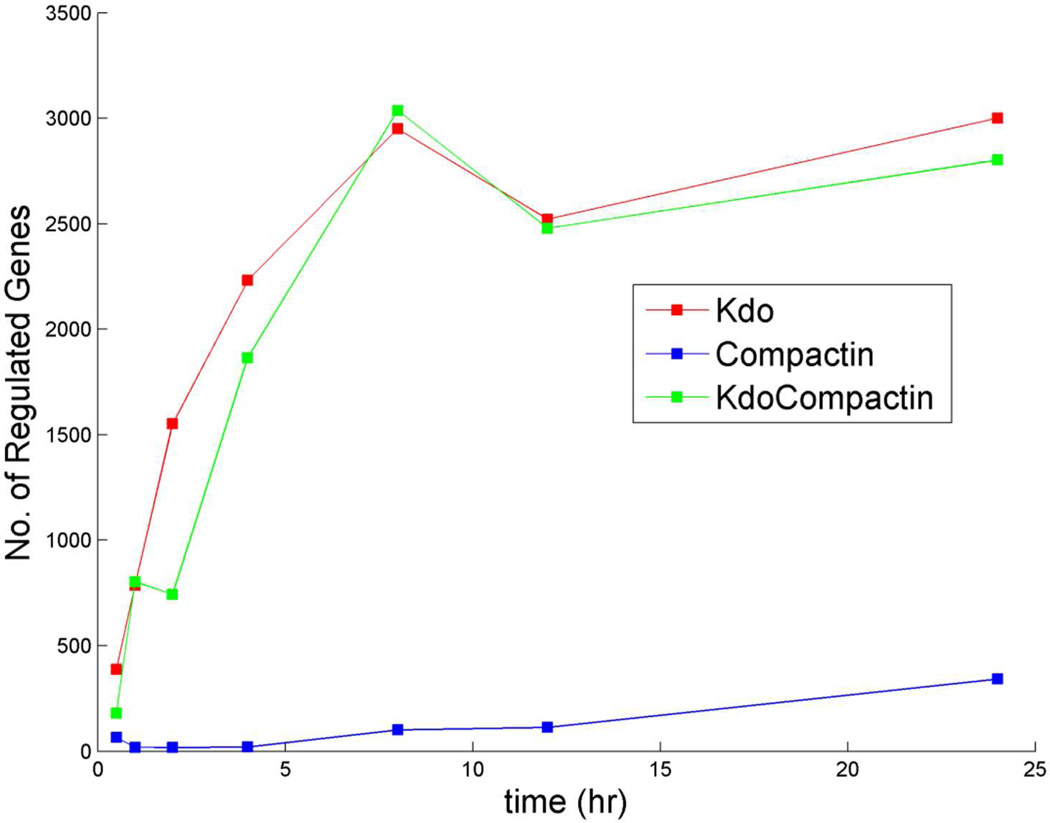
Time course of the number of regulated genes in RAW264.7 cells stimulated with KLA, Compactin and KLA+Compactin.
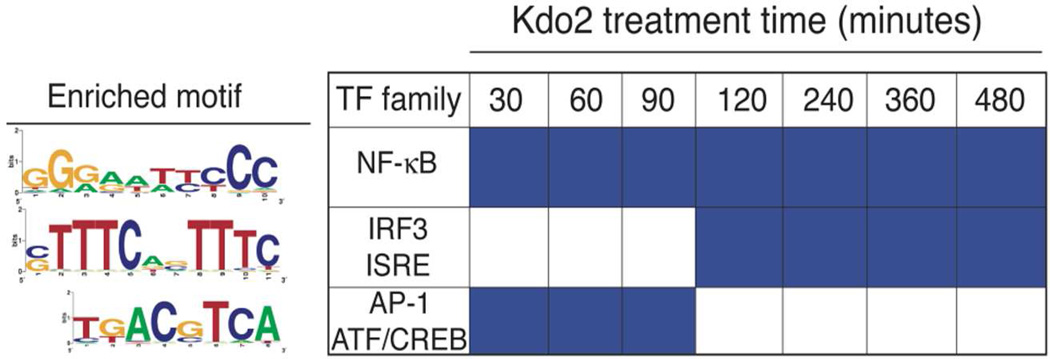
Identification of NF-κB, ISRE and AP-1/ATF/CREB binding sites in KLA-stimulated genes in RAW macrophages. Blue color indicates significant enrichment of the motif in promoters of positively regulated genes for each time point.
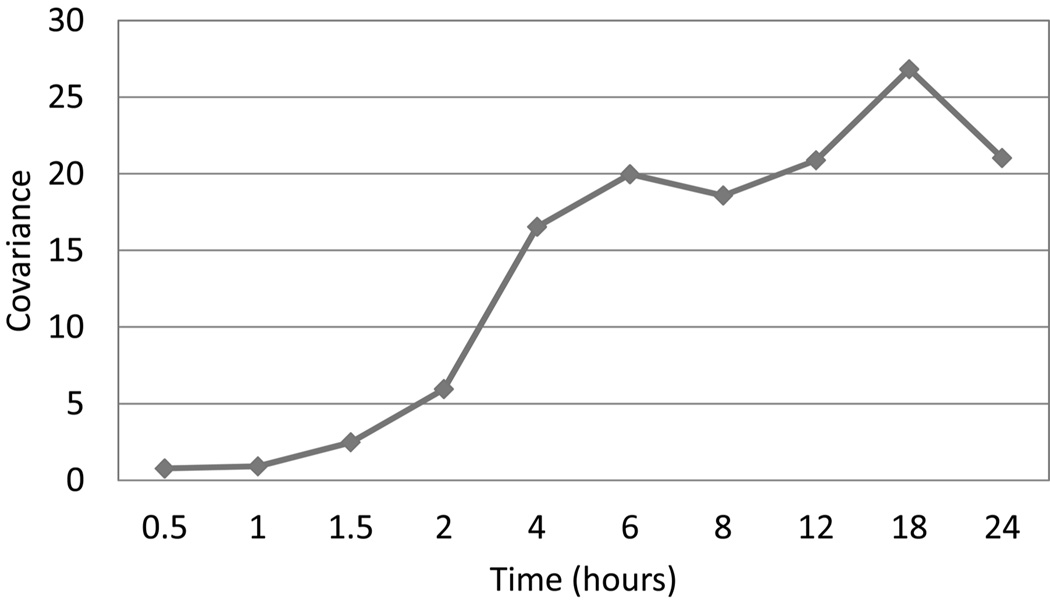
Covariance plot between 24 hour protein data from iTRAQ measurements and gene array data at various time points (only proteins with K/C ratio >1.5 were chosen).
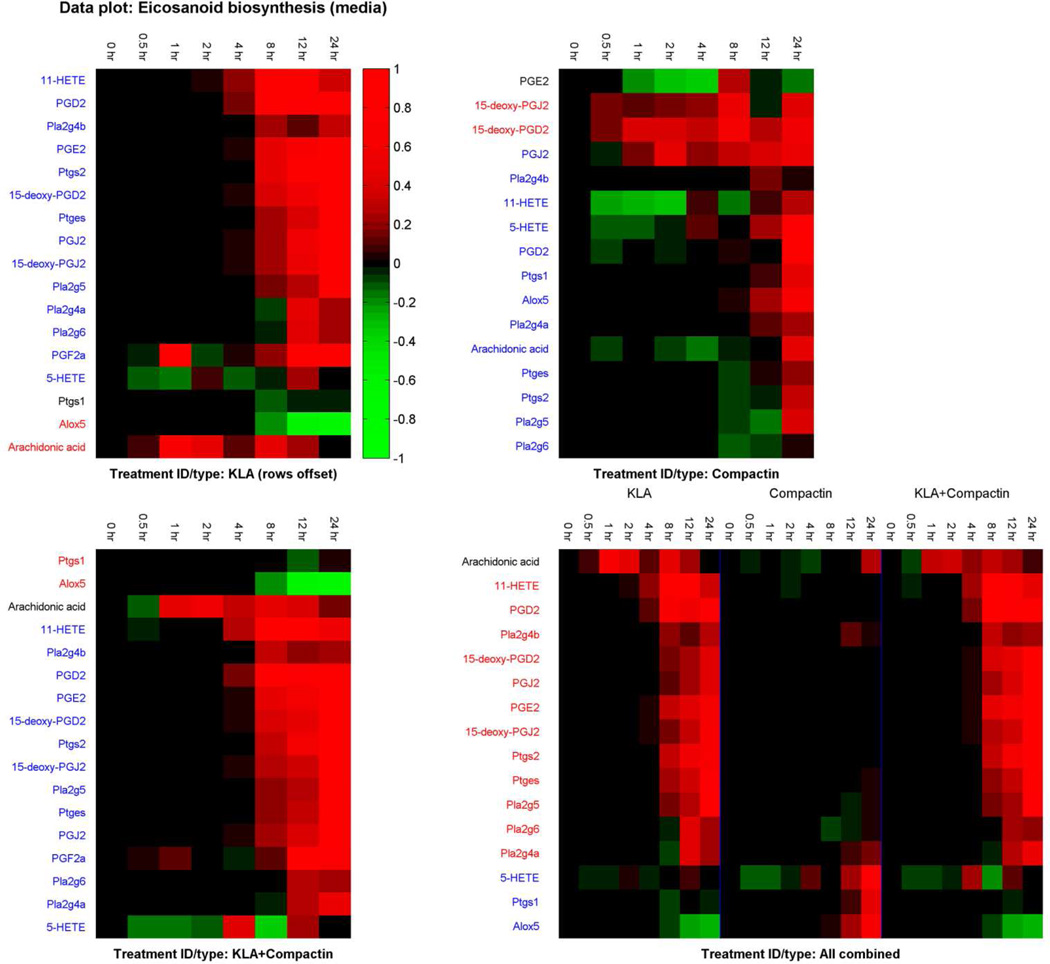
Heat map for the data for eicosanoids (measured in the media) and eicosanoid biosynthesis related genes (Reprinted with permission from Reference . Copyright 2010 American Society for Biochemistry and Molecular Biology). The four panels correspond to: (1) Data based on ratio of values for treatment with KLA to the values for control experiments, (2) ratio of compactin treatment to control, (3) ratio of treatment with both KLA and compactin to control, and (4) ratio data from (1)–(3) combined. The data in each row is scaled and offset by the t = 0 value. The names of the lipids/genes displayed on the y- and/or x-axis are listed in different colors to indicate the clusters.
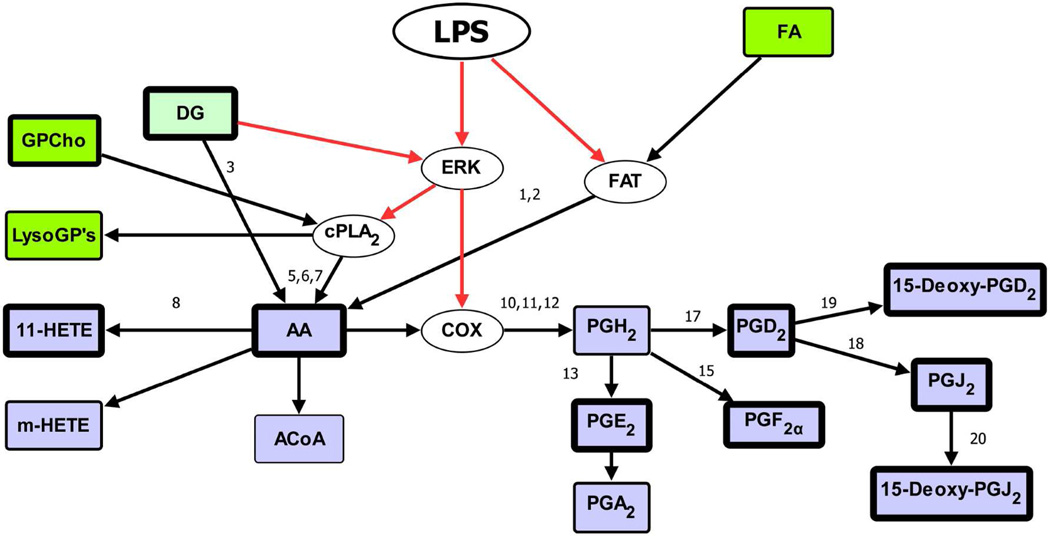
LPS/ KLA stimulated eicosanoid metabolism and signaling pathway. The numbers above the arrows are reaction numbers (Table 8) and default degradation reactions are not labeled. Black lines represent lipid metabolism and red lines indicate signaling pathways. Metabolites and enzymes are represented as rectangular and ovals boxes, respectively. The measured and unmeasured metabolites are differentiated by thick and thin borders, respectively. Purple color is used for eicosanoids and green for glycerolipids and glycerophospholipids (Reprinted with permission from Reference . Copyright 2009 Elsevier Limited).
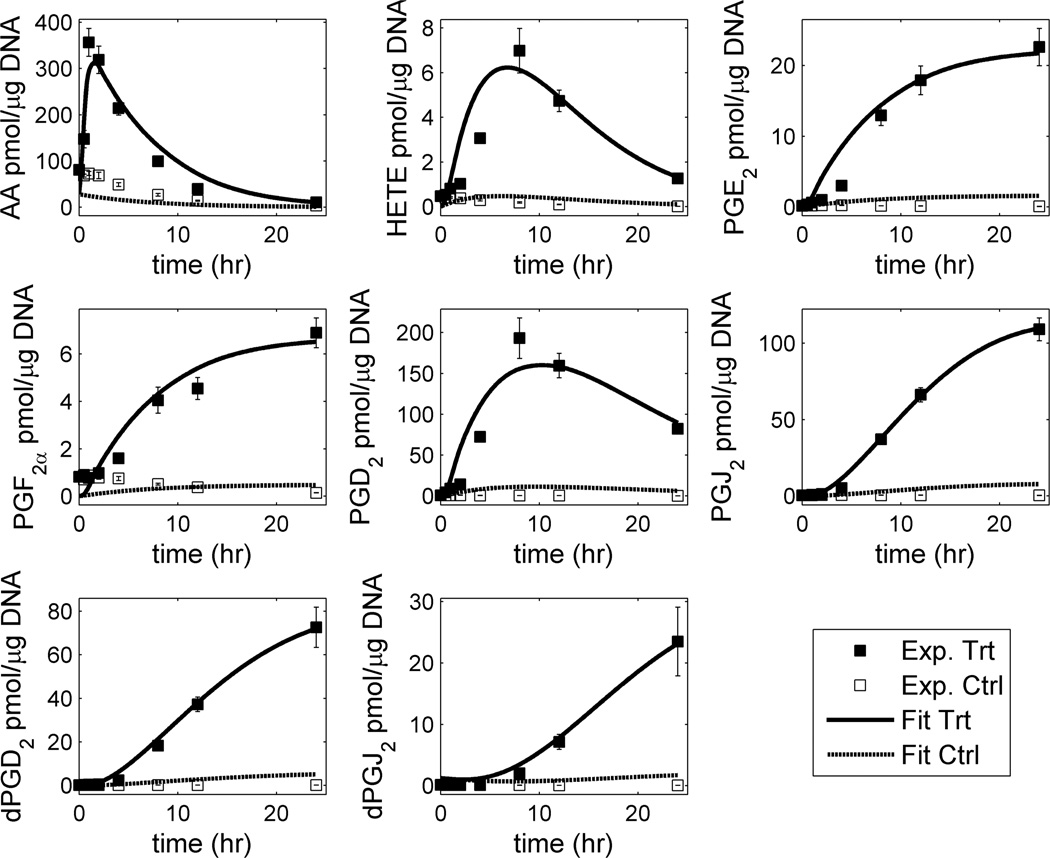
Simulation of kinetic modeling of simplified lipid network: fit of the predicted response (control and treatment with KLA) to the corresponding experimental data. In the legend, ‘Ctrl’ refers to control and ‘Trt’ refers to KLA treatment of RAW264.7 cells. The error-bars shown on the experimental data are standard-error of mean (Reprinted with permission from Reference . Copyright 2009 Elsevier Limited).
References
-
- Dennis EA, Deems RA, Harkewicz R, Quehenberger O, Brown HA, Milne SB, Myers DS, Glass CK, Hardiman GT, Reichart D, Merrill AH, Sullards MC, Wang E, Murphy RC, Raetz CR, Garrett T, Guan Z, Ryan AC, Russell DW, McDonald JG, Thompson BM, Shaw WA, Sud M, Zhao Y, Gupta S, Maurya MR, Fahy E, Subramaniam S. J. Biol. Chem. 2010;285:39976. - PMC - PubMed
-
- Wymann MP, Schneiter R. Nat. Rev. Mol. Cell Biol. 2008;9:162. - PubMed
-
- LIPID MAPS - Nature Lipidomics Gateway. www.lipidmaps.org. - PMC - PubMed
Publication types
MeSH terms
Grants and funding
LinkOut - more resources
Full Text Sources
