. 2011 Nov 11;413(5):1028-46.
doi: 10.1016/j.jmb.2011.09.008. Epub 2011 Sep 12.

Tilt-pair analysis of images from a range of different specimens in single-particle electron cryomicroscopy

Affiliations

Tilt-pair analysis of images from a range of different specimens in single-particle electron cryomicroscopy

Richard Henderson et al. J Mol Biol. .

Abstract

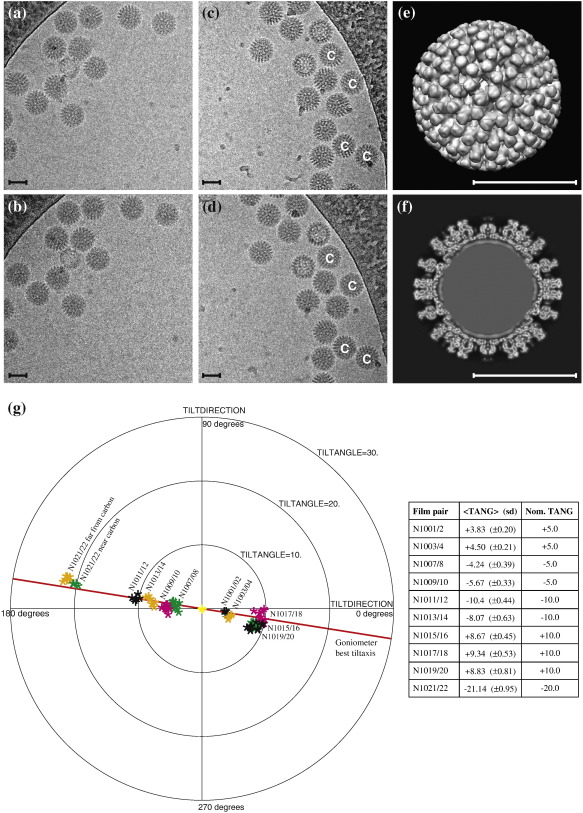
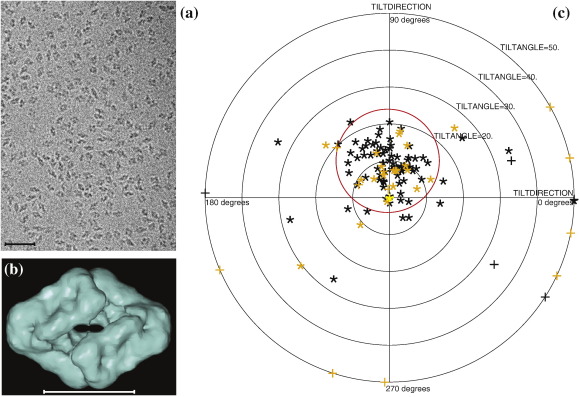
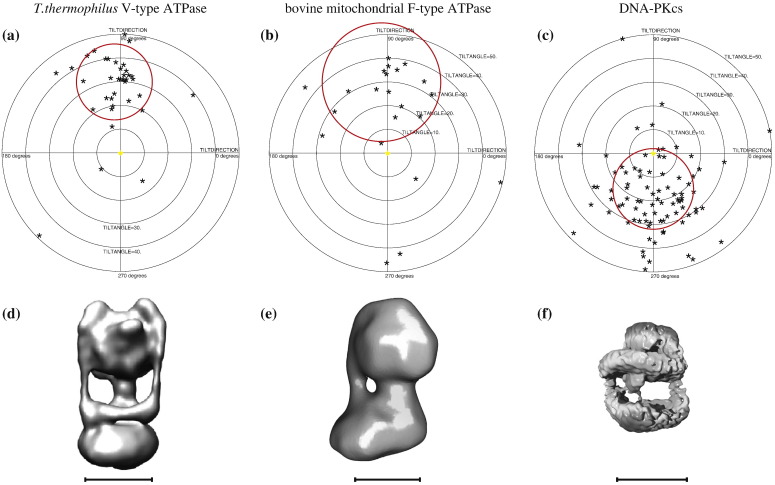
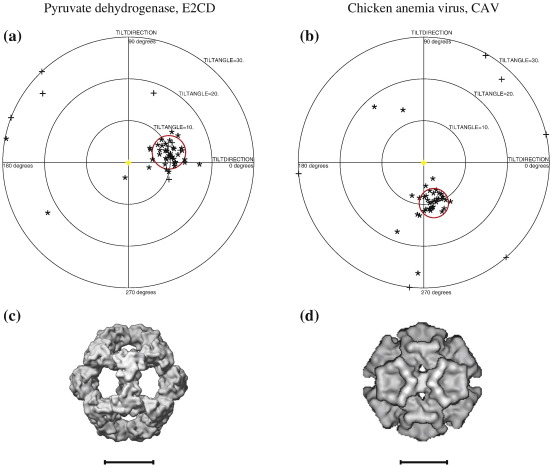
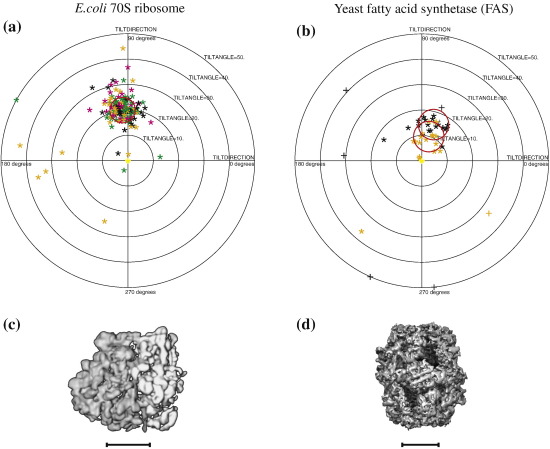
The comparison of a pair of electron microscope images recorded at different specimen tilt angles provides a powerful approach for evaluating the quality of images, image-processing procedures, or three-dimensional structures. Here, we analyze tilt-pair images recorded from a range of specimens with different symmetries and molecular masses and show how the analysis can produce valuable information not easily obtained otherwise. We show that the accuracy of orientation determination of individual single particles depends on molecular mass, as expected theoretically since the information in each particle image increases with molecular mass. The angular uncertainty is less than 1° for particles of high molecular mass (~50 MDa), several degrees for particles in the range 1-5 MDa, and tens of degrees for particles below 1 MDa. Orientational uncertainty may be the major contributor to the effective temperature factor (B-factor) describing contrast loss and therefore the maximum resolution of a structure determination. We also made two unexpected observations. Single particles that are known to be flexible showed a wider spread in orientation accuracy, and the orientations of the largest particles examined changed by several degrees during typical low-dose exposures. Smaller particles presumably also reorient during the exposure; hence, specimen movement is a second major factor that limits resolution. Tilt pairs thus enable assessment of orientation accuracy, map quality, specimen motion, and conformational heterogeneity. A convincing tilt-pair parameter plot, where 60% of the particles show a single cluster around the expected tilt axis and tilt angle, provides confidence in a structure determined using electron cryomicroscopy.


Figures

Fig. 1
Fig. 1
Rotavirus icosahedral DLPs (molecular mass, 50 MDa). (a and b) Untilted image N1017 and + 10° tilted image N1018, with relative tilt of + 10°. (c and d) + 10° tilted image N1021 and − 10° tilted image N1022, with relative tilt of − 20°. Note that images (b) and (d) were recorded after images (a) and (c) and show visible radiation damage. (e) Surface-shaded image of 3D map and (f) a section through the 3D map used to determine the orientation parameters. (g) TPPP for 10 tilt pairs recorded at different nominal tilt angles together with a table showing the experimentally determined and nominal relative tilt angles. The approximate standard deviation (SD) for the relative tilt angles, TANG, for each tilt pair is also given in parentheses. There were 95 virus particles in total, with the symbols representing each tilt pair being colored according to the micrograph from which it was selected. For the tilt pair N1021/22, the four particles that have TPPP values near the nominal, expected tilt are shown in a different color (green) in (g) and are labeled C in (c) and (d), because they are nearer the supporting carbon film. The red line in (g) shows the goniometer direction of tilt, which is at right angles to the tilt axis. Note that the outer radius of the plot has a 30° tilt angle. All scale bars represent 500 Å.
Fig. 2
Fig. 2
E. coli β-galactosidase with D2 symmetry and a molecular mass of 450 kDa. (a) Typical field of view (the scale bar represents 500 Å), (b) 3D map of β-galactosidase obtained using 6500 particle images processed using EMAN2 (the scale bar represents 100 Å), and (c) TPPP from particles from two image pairs (black and orange symbols), recorded with a relative tilt angle of 10°. The outer radius of the plot is 50°, the red circle has a radius of 14°, and it is centered at the expected tilt angle set on the goniometer.
Fig. 3
Fig. 3
TPPPs for (a) V-type ATPase (molecular mass, 600 kDa), (b) F-type ATPase (molecular mass, 600 kDa), and (c) DNA-PKcs (molecular mass, 470 kDa), with surface-shaded representations of the 3D maps used for the orientation determination, (d) V-type ATPase, (e) F-type ATPase, and (f) DNA-PKcs. The radii of the red circles are 16°, 25°, and 17°, respectively, and the outer radii of the plots are 50°. The red circles are centered at the expected relative tilt angles of 30°, 30°, and 15°. These three structures have C1 point group symmetry (i.e., no symmetry). All scale bars represent 100 Å.
Fig. 4
Fig. 4
TPPPs for two icosahedral structures both with relative tilt angles of 10°. (a) PDH catalytic domain (molecular mass, 1.6 MDa); the red circle has a radius of 4°. (b) CAV (molecular mass, 2.7 MDa); the red circle has a radius of 3.5°. The surface-shaded 3D maps used for the orientation determination are shown in (c) PDH and (d) CAV. The data used for this figure are from Rosenthal and Henderson and Crowther et al., respectively. The “+” symbols indicate particles whose out-of-plane error is greater than 1.5× the average. All scale bars represent 100 Å.
Fig. 5
Fig. 5
TPPPs. (a) E. coli 70S ribosome (symmetry, C1; molecular mass, 2.6 MDa). There were 12 tilt pairs recorded at − 10° and + 10° tilt angles to give relative tilt angles of 20°. The red circle has a 5° radius centered on the + 20° relative goniometer tilt. (b) Yeast FAS (symmetry, D3; molecular mass, 2.6 MDa). There were two tilt pairs with relative tilt angles of 10° (± 5°, orange symbols) and 15° (± 7.5°, black symbols). The red circles have radii of 6° centered on the expected positions. Surface-shaded views of the 3D maps used for the orientation determination are shown in (c) 70S ribosome and (d) FAS. The tilt-pair images used to produce these plots were collected as part of this work. The 3D maps were downloaded from the EMDB. All scale bars represent 100 Å.
Fig. 6
Fig. 6
Number of particles in which the tilt-pair relative orientations are clustered around the expected tilt axis and tilt angle, plotted as a function of the lower- and higher-resolution cutoffs used in FREALIGN: (a) rotavirus within the 2°-radius circle, (b) CAV within 3.5°, and (c) β-galactosidase within 14°. The double arrowhead shows the resolution range that contributes most to the orientation determination. When the low-resolution cutoff was varied, the high-resolution cutoff was set to its maximum value, and vice versa.

References

    1. DeRosier D.J., Klug A. Reconstruction of three dimensional structures from electron micrographs. Nature. 1968;217:130–134. - PubMed
    1. Crowther R.A., Amos L.A., Finch J.T., De Rosier D.J., Klug A. Three dimensional reconstructions of spherical viruses by Fourier synthesis from electron micrographs. Nature. 1970;226:421–425. - PubMed
    1. Henderson R., Unwin P.N.T. Three-dimensional model of purple membrane obtained by electron microscopy. Nature. 1975;257:28–32. - PubMed
    1. Radermacher M., Wagenknecht T., Verschoor A., Frank J. Three-dimensional structure of the large ribosomal subunit from Escherichia coli. EMBO J. 1987;6:1107–1114. - PMC - PubMed
    1. Dubochet J., Adrian M., Chang J.J., Homo J.C., Lepault J., McDowall A.W., Schultz P. Cryo-electron microscopy of vitrified specimens. Q. Rev. Biophys. 1988;21:129–228. - PubMed

Substances

LinkOut - more resources