. 2012 Apr;123(4):670-80.
doi: 10.1016/j.clinph.2011.07.050. Epub 2011 Sep 21.

Automatic detection of fast oscillations (40-200 Hz) in scalp EEG recordings

Affiliations

Automatic detection of fast oscillations (40-200 Hz) in scalp EEG recordings

Nicolás von Ellenrieder et al. Clin Neurophysiol. 2012 Apr.

Abstract

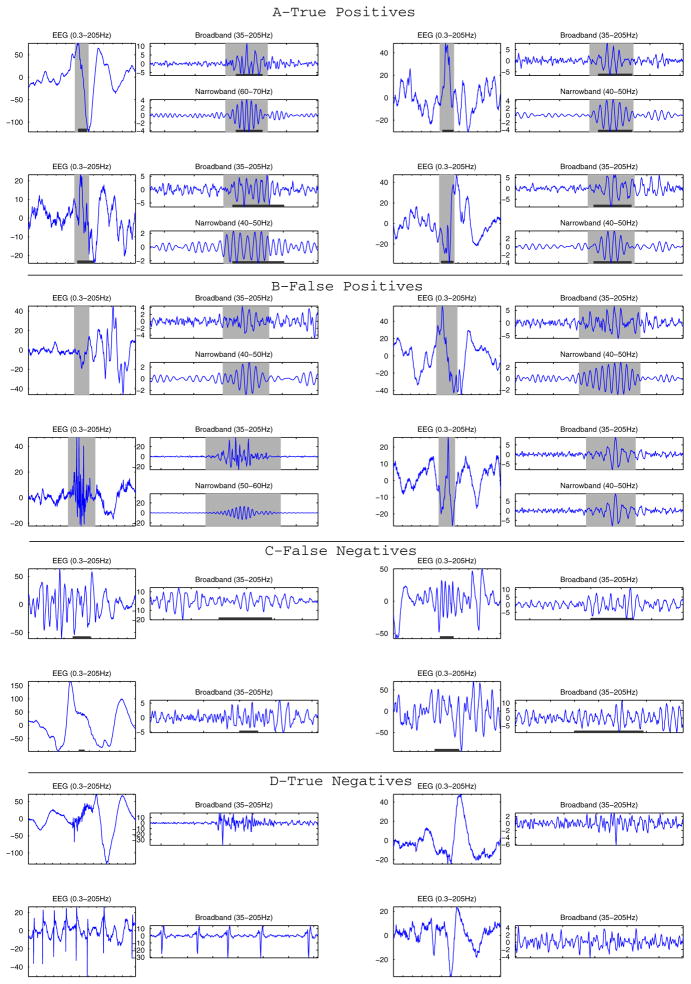
Objective: We aim to automatically detect fast oscillations (40-200 Hz) related to epilepsy on scalp EEG recordings.

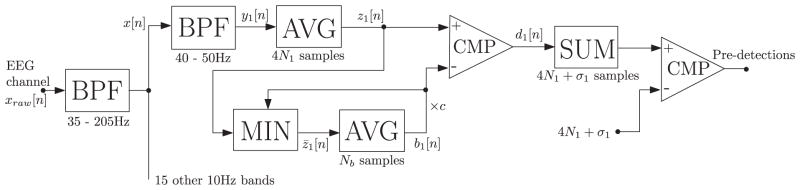
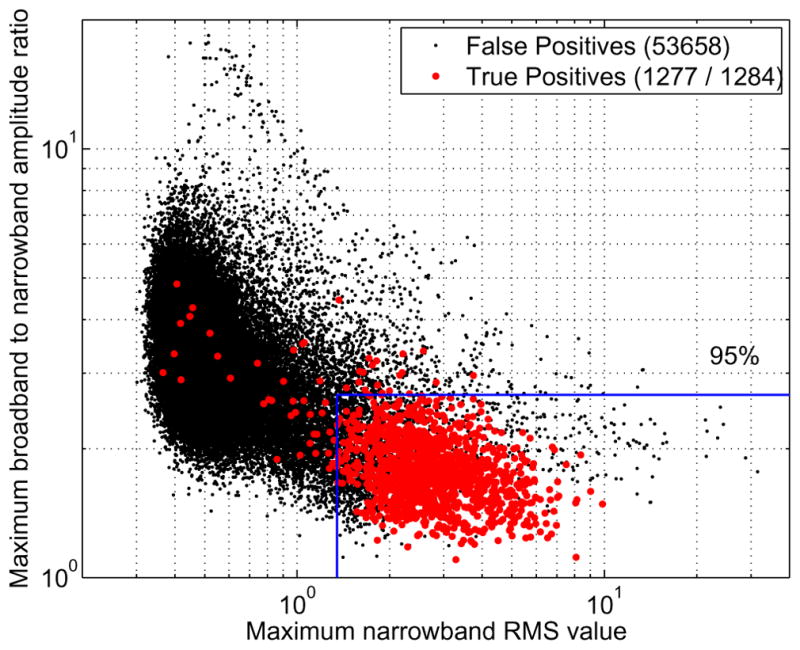
Methods: The detector first finds localized increments of the signal power in narrow frequency bands. A simple classification based on two features, a narrowband to wideband signal amplitude ratio and an absolute narrowband signal amplitude, then allows for an important reduction in the number of false positives.

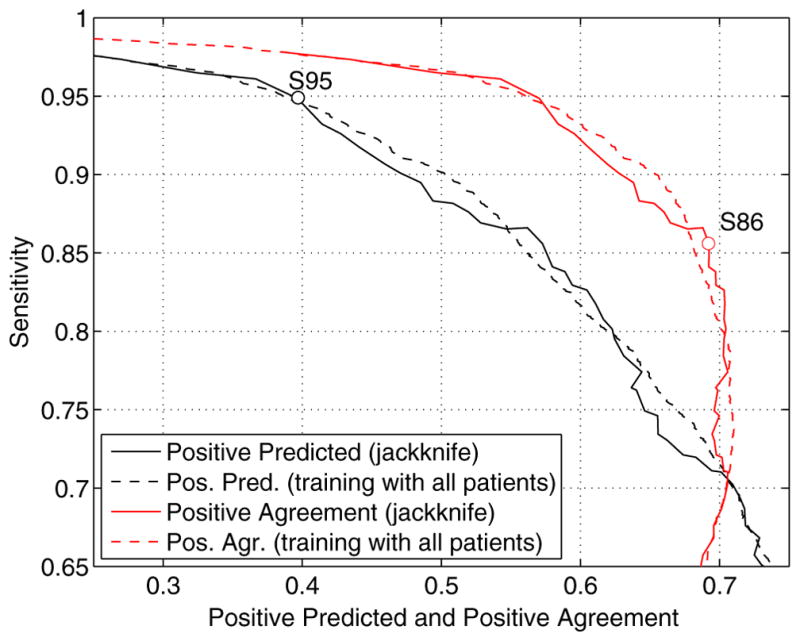
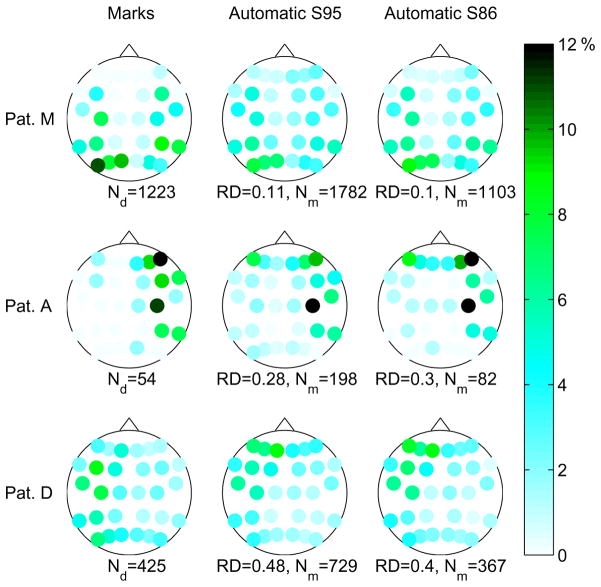
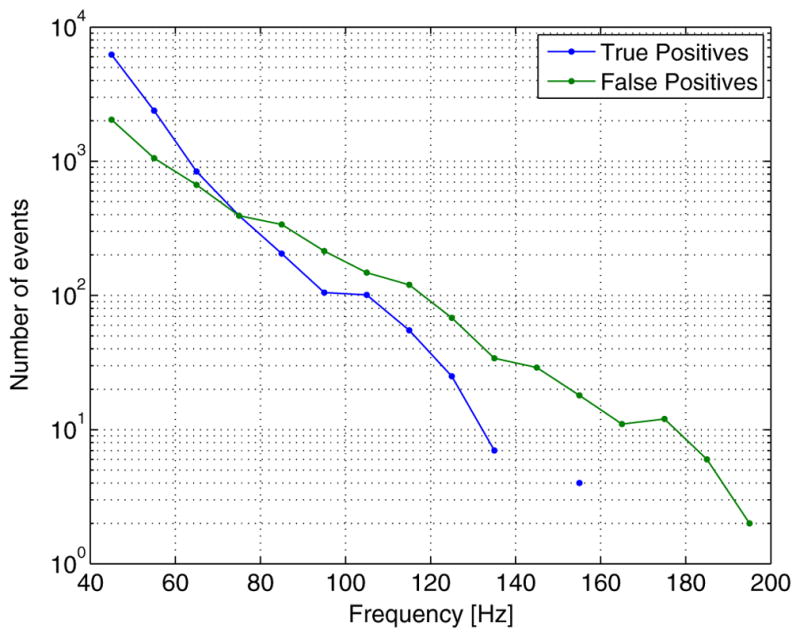
Results: When compared to an expert, the performance in 15 focal epilepsy patients resulted in 3.6 false positives per minute at 95% sensitivity, with at least 40% of the detected events being true positives. In most of the patients the channels showing the highest number of events according to the expert and the automatic detector were the same.

Conclusions: A high sensitivity is achieved with the proposed automatic detector, but results should be reviewed by an expert to remove false positives.

Significance: The time required to mark fast oscillations on scalp EEG recordings is drastically reduced with the use of the proposed detector. Thus, the automatic detector is a useful tool in studies aiming to create a better understanding of the fast oscillations visible on the scalp.


Figures

Fig. 1
Fig. 1
Diagram of the pre-detection processing. The passband of the band-pass filters (BPF) in indicated below the corresponding block. Below the averaging (AVG) and adding (SUM) blocks we indicate the number of involved samples. The comparing (CMP) blocks have unit output if the difference between inputs is grater than zero, and zero output otherwise.
Fig. 2
Fig. 2
Feature values of the events after the detection stage, for the 15 patients set. Each point corresponds to a subject level event, and is either a true or false positive based on the expert’s marks. The number of events is given in the legend. An example of threshold values used for the classification is also shown, corresponding to the optimum threshold values to obtain 95% sensitivity considering all the patients as training data.
Fig. 3
Fig. 3
(A) Example of true positive events illustrating clear events marked by the expert and identified by the detector. (B) Examples of false positive events; some look like genuine FOs that may have been missed by the expert and others are clearly part of artefacts. (C) Example of false negatives: these events marked by the expert but were not very clear and probably for this reason were missed by the detector. (D) True negatives show transients that were not marked by the expert and not detected. Gray background indicates detections of the automatic detector and dark lines at the bottom of the figures are expert’s marks. The EEG signal (0.3–205 Hz) and the broadband signal (35–205 Hz) are shown for each event, and the narrowband signal at which an event was detected are shown for the true and false positive detections. The Amplitude is given in μV, the ticks in the time axes correspond to 100 ms intervals.
Fig. 4
Fig. 4
Performance curves of the automatic detector. Sensitivity vs. positive predicted and sensitivity vs. positive agreement curves are shown. The curves obtained with a jackkinfe approach (leave one out) are the curves used in the rest of the study. The curves obtained when training with all the patients are shown for comparison purposes. Two possible operating points (S95 and S86) are indicated in the curves.
Fig. 5
Fig. 5
Channel involvement results. Every dot corresponds to a bipolar channel on the scalp. The color/gray level of the dots indicates the proportion of events in that particular channel. Left: distribution of expert’s marks. Center and right: distribution of detections of automatic detector at operating points S95 and S85, respectively. The total number of events is given below each diagram, as well as the ranking distance (RD) value for the automatic detector. Results are shown for three patients with different RD values.
Fig. 6
Fig. 6
Number of detected events at different frequency bands. True positives and false positives of the automatic detector at operating point S95.

Comment in

References

    1. Aarabi A, Grebe R, Wallois F. A multistage knowledge-based system for EEG seizure detection in newborn infants. Clin Neurophysiol. 2007;118:2781–97. - PubMed
    1. Andrade-Valença L, Dubeau F, Mari F, Zelmann R, Gotman J. Interictal scalp fast oscillations as a marker of the seizure onset zone. Neurology. 2011;77:524–31. - PMC - PubMed
    1. Bragin A, Engel J, Jr, Wilson CL, Fried I, Mathern GW. Hippocampal and entorhinal cortex high-frequency oscillations (100–500 Hz) in human epileptic brain and in kainic acid-treated rats with chronic seizures. Epilepsia. 1999a;40:127–37. - PubMed
    1. Bragin A, Engel J, Jr, Wilson CL, Vizentin E, Mathern GW. Electrophysiologic analysis of a chronic seizure model after unilateral hippocampal KA injection. Epilepsia. 1999b;40:1210–21. - PubMed
    1. Bragin A, Engel J, Jr, Wilson CL, Fried I, Buzsaki G. High frequency oscillations in human brain. Hippocampus. 1999b;9:137–42. - PubMed

Publication types