. 2011 Sep 21;31(38):13452-7.
doi: 10.1523/JNEUROSCI.2156-11.2011.

Tinnitus with a normal audiogram: physiological evidence for hidden hearing loss and computational model

Affiliations

Tinnitus with a normal audiogram: physiological evidence for hidden hearing loss and computational model

Roland Schaette et al. J Neurosci. .

Abstract

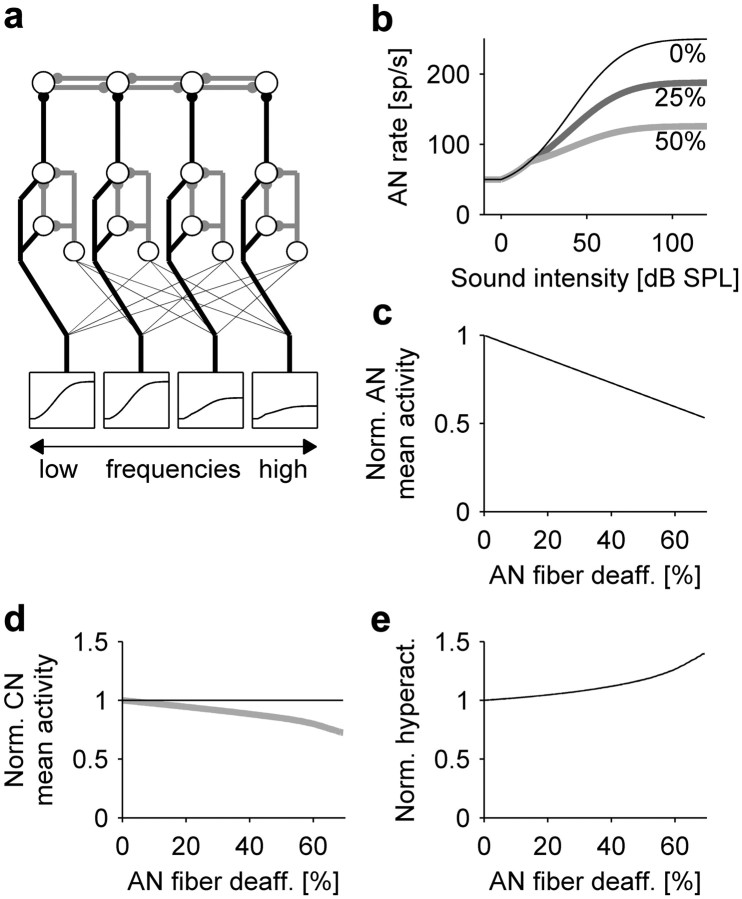
Ever since Pliny the Elder coined the term tinnitus, the perception of sound in the absence of an external sound source has remained enigmatic. Traditional theories assume that tinnitus is triggered by cochlear damage, but many tinnitus patients present with a normal audiogram, i.e., with no direct signs of cochlear damage. Here, we report that in human subjects with tinnitus and a normal audiogram, auditory brainstem responses show a significantly reduced amplitude of the wave I potential (generated by primary auditory nerve fibers) but normal amplitudes of the more centrally generated wave V. This provides direct physiological evidence of "hidden hearing loss" that manifests as reduced neural output from the cochlea, and consequent renormalization of neuronal response magnitude within the brainstem. Employing an established computational model, we demonstrate how tinnitus could arise from a homeostatic response of neurons in the central auditory system to reduced auditory nerve input in the absence of elevated hearing thresholds.


Figures

Figure 1.
Figure 1.
Auditory brainstem responses in tinnitus with normal hearing thresholds. a, Mean audiogram (black line) and mean tinnitus spectrum (dotted line) of the tinnitus group (n = 15) and mean audiogram of the control group (gray line, n = 18). TS, Tinnitus spectrum. b, Example ABR waveform of a tinnitus (black line) and a control subject (gray line) for 50 μs clicks at 100 dB SPL. The roman numerals label waves I, III, and V of the ABR. c, Mean amplitudes of ABR wave I are significantly lower in the tinnitus (black) than in the control group (gray, p = 0.009, two-way ANOVA), whereas amplitudes of wave V do not differ significantly. d, Wave I amplitude normalized by wave V amplitude also shows a significant difference between tinnitus and control (p = 0.004, two-way ANOVA).
Figure 2.
Figure 2.
Auditory brainstem responses, hidden hearing loss, and homeostatic gain control in the auditory system. a, Illustration of the generation sites of wave I (auditory nerve) and wave V (midbrain) of the ABR, schematic depiction of an inner hair cell of the cochlea and of the AN fibers contacting it, and the rate-versus-intensity functions of the different types of auditory nerve fibers (green, low threshold fibers; blue, medium threshold fibers; red, high threshold fibers). b, Illustration of how homeostatic gain control in the auditory brainstem could normalize wave V amplitude after hidden hearing loss. In the healthy situation (top), a complete population of AN fibers gives rise to a full-sized ABR wave I, response gain in the brainstem is low, and wave V has a normal amplitude. In hidden hearing loss (bottom), a fraction of the AN fibers no longer responds to sound, leading to a reduced amplitude of ABR wave I; but through increased response gain, the amplitude of wave V has been restored to a normal size.
Figure 3.
Figure 3.
A computational model demonstrates how AN fiber deafferentation (deaff.) could lead to tinnitus-related neuronal hyperactivity. a, Architecture of the model covering auditory nerve (bottom), cochlear nucleus (middle), and a central processing stage with lateral inhibition (top); four frequency channels are shown. Circles denote neurons, black lines excitatory connections, and gray lines inhibitory connections. b, Model AN rate-versus-intensity functions are scaled down to account for deafferentation of AN fibers. sp/s, Spikes per second. c, The mean AN activity is reduced in proportion to the degree of deafferentation. Norm., Normalized. d, Mean activity in the CN stage of the model before (gray line) and after activity stabilization through homeostatic plasticity. e, Increased spontaneous firing rates (hyperactivity) as a side effect of activity stabilization.
Figure 4.
Figure 4.
Relating measurements and model. a, Central gain (mean ratio of ABR wave V/I) in tinnitus subjects normalized by control subjects. Rel., Relative. b, Model results for the increase in central excitatory gain through homeostatic plasticity. The dotted lines indicate that gain increases as observed in tinnitus were observed in the model for 53 and 61% AN fiber deafferentation. c, Profile of spontaneous activity in the lateral-inhibition layer of the model for ∼60% AN fiber deafferentation above 4 kHz before (gray line) and after homeostasis (black line). Norm., Normal. d, Simulated ABR wave I for a normal cochlea (gray line) and for deafferentation of 60% of the AN fibers above 4 kHz (black line), which reduces wave I amplitude by 22%. arb., Arbitrary.

Similar articles

Cited by

References

    1. Barnea G, Attias J, Gold S, Shahar A. Tinnitus with normal hearing sensitivity: extended high-frequency audiometry and auditory-nerve brain-stem-evoked responses. Audiology. 1990;29:36–45. - PubMed
    1. Bauer CA, Brozoski TJ, Myers K. Primary afferent dendrite degeneration as a cause of tinnitus. J Neurosci Res. 2007;85:1489–1498. - PubMed
    1. Desai NS, Rutherford LC, Turrigiano GG. Plasticity in the intrinsic excitability of cortical pyramidal neurons. Nat Neurosci. 1999;2:515–520. - PubMed
    1. Dominguez M, Becker S, Bruce I, Read H. A spiking neuron model of cortical correlates of sensorineural hearing loss: Spontaneous firing, synchrony, and tinnitus. Neural Comput. 2006;18:2942–2958. - PubMed
    1. Don M, Eggermont JJ. Analysis of the click-evoked brainstem potentials in man using high-pass noise masking. J Acoust Soc Am. 1978;63:1084–1092. - PubMed

Publication types