

"Overshoot" of O₂ is required to maintain baseline tissue oxygenation at locations distal to blood vessels
- PMID: 21940458
- PMCID: PMC3188944
- DOI: 10.1523/JNEUROSCI.1968-11.2011
"Overshoot" of O₂ is required to maintain baseline tissue oxygenation at locations distal to blood vessels
Abstract
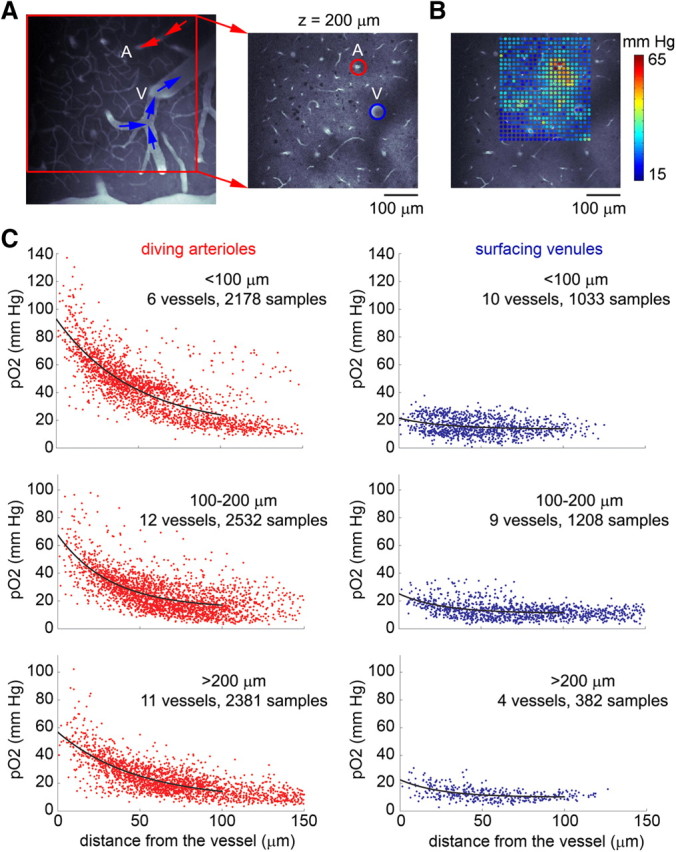
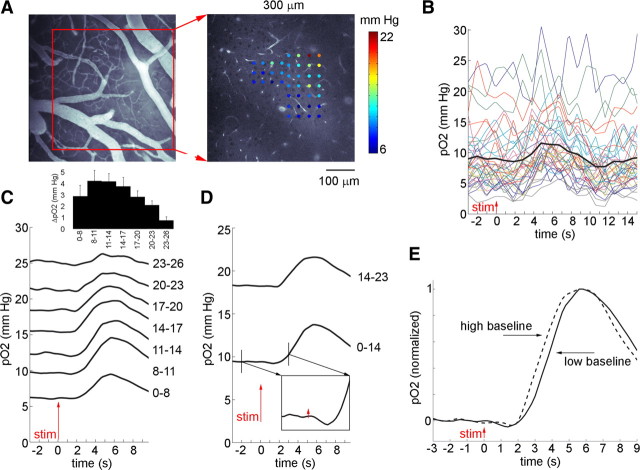
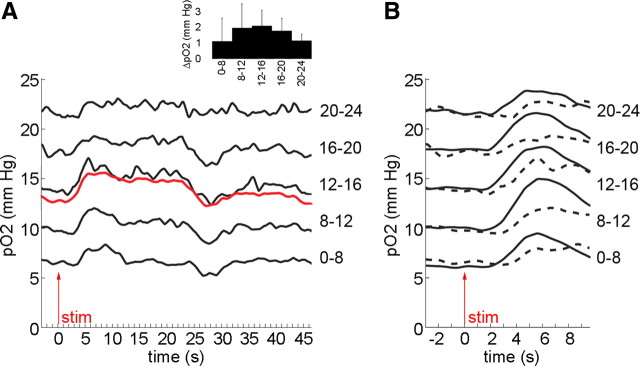
In vivo imaging of cerebral tissue oxygenation is important in defining healthy physiology and pathological departures associated with cerebral disease. We used a recently developed two-photon microscopy method, based on a novel phosphorescent nanoprobe, to image tissue oxygenation in the rat primary sensory cortex in response to sensory stimulation. Our measurements showed that a stimulus-evoked increase in tissue pO₂ depended on the baseline pO₂ level. In particular, during sustained stimulation, the steady-state pO₂ at low-baseline locations remained at the baseline, despite large pO₂ increases elsewhere. In contrast to the steady state, where pO₂ never decreased below the baseline, transient decreases occurred during the "initial dip" and "poststimulus undershoot." These results suggest that the increase in blood oxygenation during the hemodynamic response, which has been perceived as a paradox, may serve to prevent a sustained oxygenation drop at tissue locations that are remote from the vascular feeding sources.
Figures
References
-
- Ances BM, Wilson DF, Greenberg JH, Detre JA. Dynamic changes in cerebral blood flow, O2 tension, and calculated cerebral metabolic rate of O2 during functional activation using oxygen phosphorescence quenching. J Cereb Blood Flow Metab. 2001;21:511–516. - PubMed
-
- Buxton RB, Uludag K, Dubowitz DJ, Liu TT. Modeling the hemodynamic response to brain activation. Neuroimage. 2004;23(Suppl 1):S220–S233. - PubMed
-
- Chance B, Cohen P, Jobsis F, Schoener B. Intracellular oxidation-reduction states in vivo. Science. 1962;137:499–508. - PubMed
Publication types
MeSH terms
Substances
Grants and funding
- R21 EB012620/EB/NIBIB NIH HHS/United States
- EB009118/EB/NIBIB NIH HHS/United States
- EB007279/EB/NIBIB NIH HHS/United States
- S10 RR029050/RR/NCRR NIH HHS/United States
- R01 NS057198/NS/NINDS NIH HHS/United States
- EB00790/EB/NIBIB NIH HHS/United States
- R01 EB007279/EB/NIBIB NIH HHS/United States
- P01 NS055104/NS/NINDS NIH HHS/United States
- NS051188/NS/NINDS NIH HHS/United States
- R01 NS036722/NS/NINDS NIH HHS/United States
- K99 NS067050/NS/NINDS NIH HHS/United States
- R01 NS051188/NS/NINDS NIH HHS/United States
- EB2066/EB/NIBIB NIH HHS/United States
- R01 NS057476/NS/NINDS NIH HHS/United States
- R01 EB000790/EB/NIBIB NIH HHS/United States
- NS057476/NS/NINDS NIH HHS/United States
- NS057198/NS/NINDS NIH HHS/United States
- NS055104/NS/NINDS NIH HHS/United States
- R01 EB002066/EB/NIBIB NIH HHS/United States
- R00 NS067050/NS/NINDS NIH HHS/United States
- R21 EB009118/EB/NIBIB NIH HHS/United States
LinkOut - more resources
Full Text Sources
Other Literature Sources